_________________________________________________
Click here for information on our eLearning version of “Introduction to Crowd Science”
_________________________________________________
The tool is included in the eLearning system - click here for furhter information.
Over the last 28 years some questions kept recurring during the workshops. Namely
"We don't know how many people may come to our event."
"What's the best way to estimate numbers of people?"
"How do you estimate crowd density?"
"How do we assess/measure risk for crowded spaces?"
I developed this planning and operations tool to specifically address the above questions. For example, visualising crowd sizes at Old Trafford (below) 5,000 and 20,000 respectively and planning the Royal Wedding crowd build up. Coupled with the RAMP Analysis (see this link on how we applied RAMP analysis to the Trump inauguration).
'The danger for police commanders in planning and dealing with major events is that we become focussed on one area , normally public order, when in actual fact we should be considering a range of overlapping and inter-related disciplines of which crowd dynamics should be writ large. An awareness of the area should be a prerequisite for those policing events and commanders should be able to recognise risk at events and utilise the available specialists in appropriate circumstances. I can think of one high profile football match in the last year where I was glad issues of crowd dynamics were in my considerations as there was clear potential for a serious incident if the wrong calls had been made. As a consequence in planning for this years Manchester united victory parade one of my first calls was to Keith Still to ensure I had his support in reviewing the issues around crowd dynamics - a previous parade had attracted 250,000 fans and there had been a real risk of people getting seriously hurt. In this case Keith's involvement gave me the reassurance that the issues would be recognised and that we could develop the right plans and mitigation measures.' Mark Roberts. Chief Superintendent. Trafford Division. Greater Manchester Police
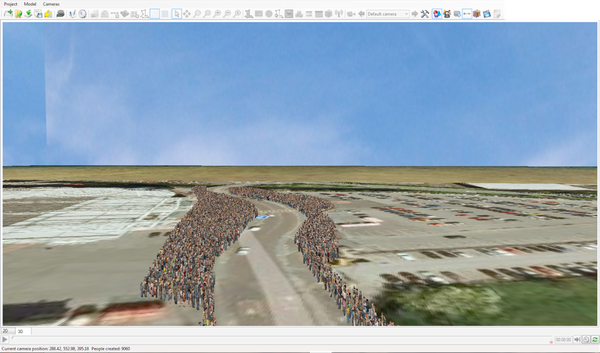
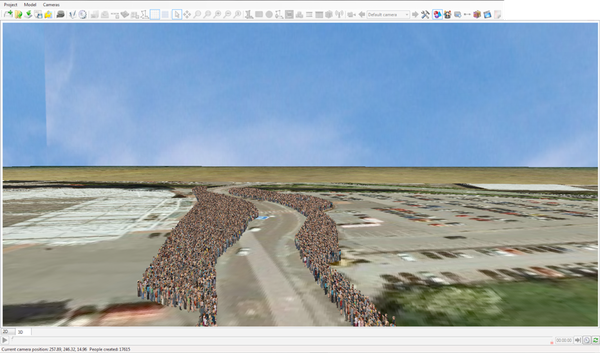
The modelling system was used for assessing the Mall capacity analysis for the Royal Wedding
The production of high quality images provides CCTV references and (in the images below) from ground level to helicopter views. We can then use this to compare and contrast the model with the situation on the day. Using visual references we assist in the accurate assessment of numbers and density on the ground. Visuals, like these, are used in control rooms to provide an aid to estimating density in real-time.
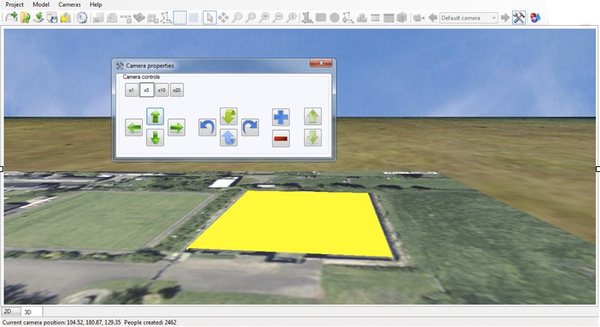
Below is a screen shot of the integrated modelling system, showing my local tennis court. I use this too to assess the capacity of the site, viewing angles and ingress/egress capacity for normal and emergency situations.
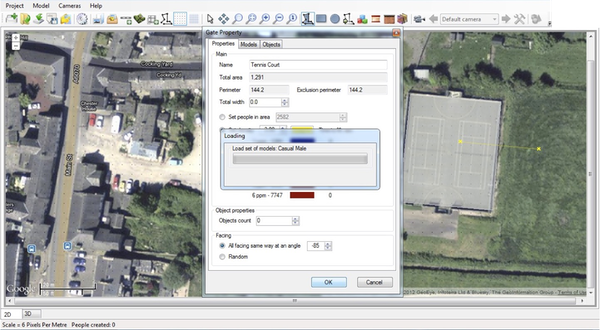
Once the basic site map is defined the user can switch to 3D view and fly around the site, viewing the are and populating it with crowd at varying densities. Setting up virtual CCTV cameras and producing a range of graphic views of the crowds, at different densities and different angles. The report produces flow rates for different arrival profiles and a range of information relating to crowd build up for the site.
Here are the links to a range of screen shots from the above site, showing crowd density from different angles.
Tennis court - reference crowd 100 square metres 1
Tennis court - reference crowd 100 square metres 2
Tennis court - reference crowd 100 square metres 3
Tennis court - reference crowd 100 square metres 4
Tennis court - reference crowd 100 square metres 5
Tennis court - reference crowd 100 square metres 6
Tennis court - reference crowd 625 square metres 1
Tennis court - reference crowd 625 square metres 2
Tennis court - reference crowd 625 square metres 3
Tennis court - reference crowd 625 square metres 4
Tennis court - reference crowd 625 square metres 5
Tennis court - reference crowd 625 square metres 6
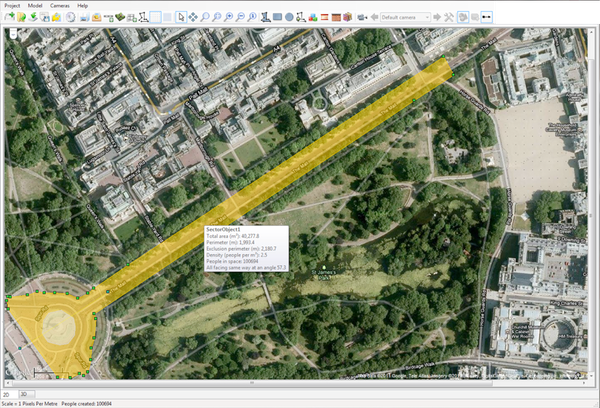
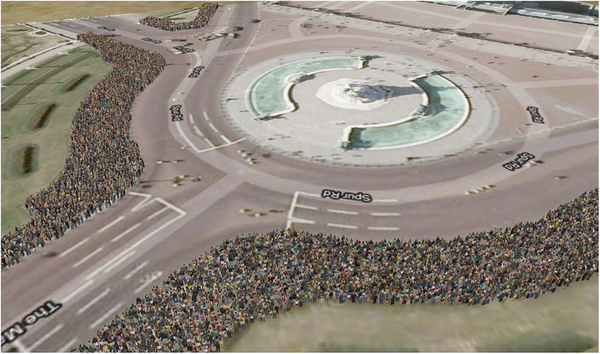
Below is one of the planning visuals for the Queen Victoria Memorial - I used this to assess the numbers and welfare for the crowd management plan at the Royal Wedding (2o11). Barrier plans, cutting back on the flowerbeds and site capacity were all critical elements for this specific area during the crowd management planning exercises. The visuals informed the team on how it would look on the day, from a wide range of angles, helicopter views, ground level views and views from CCTV were all created in the 3D modelling system.
Click the hyperlink for more information on modelling the crowd build up for the Royal Wedding 29th April 2011.