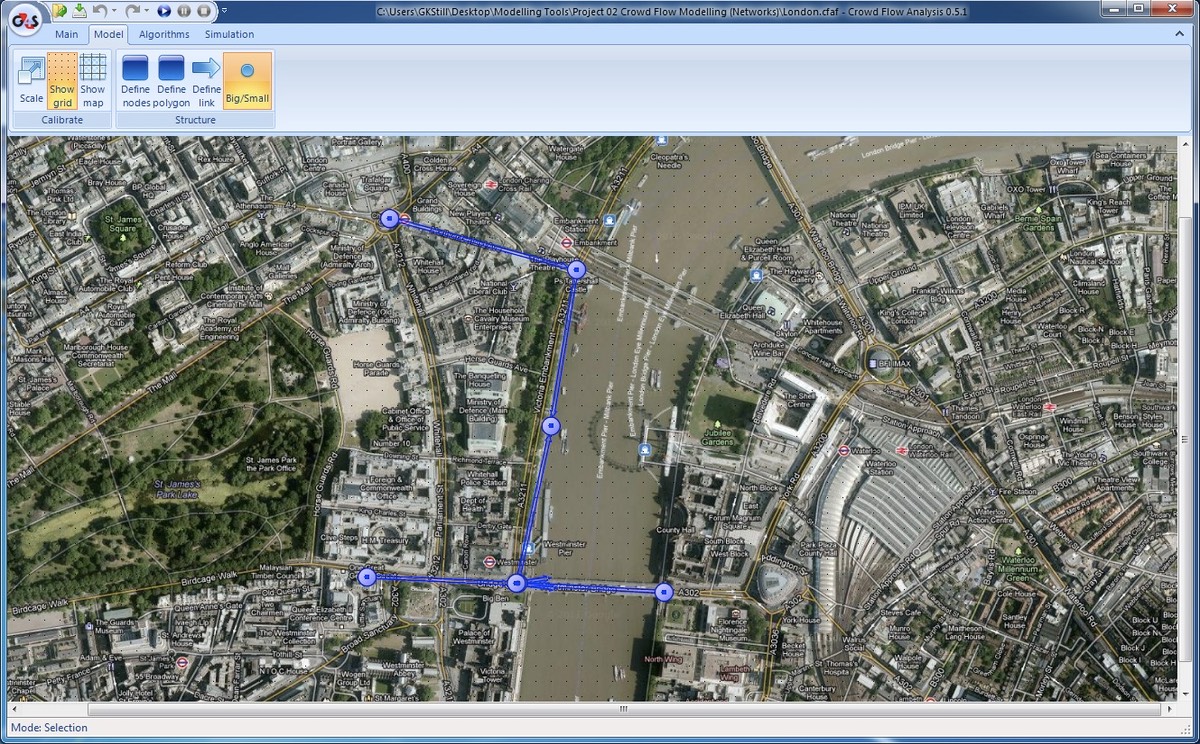
When I need to assess complex sites I use anetwork analysis tool, this allows me to construct a network of links and areas of interest. I can then input crowd arrival profiles and evaluate the times for areas to fill (using a new proprietary set of algorithms based on both pressure analysis and non-linear crowd flow - see this link for details). The output of this tool allows me to then build fill predictors for major events.
Below is an image from the integrated modelling tools developed over the last two years. These allow me to construct complex crowd flow networks and test a range of arrival profiles for sites/venues/events. Assessing crowd build up and defining a crowd management plan is part of the wide range of support services I offer to the industry - both as a consultant and through the training and education packages offered (see the site map for further information).
Installed in 2006 I modelled the London New Year Event and have run pre-event and post-event workshops for the last 6 years the crowd management of the site. The older tools (Myriad II) were used to assess the crowd build up (graph on the left) and these allowed a wide range of site metrics. The new tools (image above) have 3D modelling capacity for agents, network, spatial and risk analysis for complex environments - click here for further information.
Complex street flow analysis
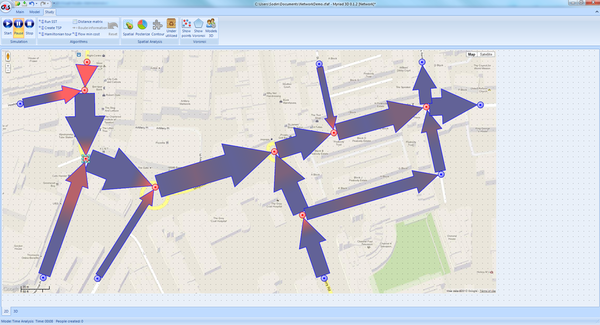
If we have combined flows from multiple directions and different demands on each route (trains/busses, walking, etc) then the combined flows are best analysed in a network model. Below is a typical model for combined flows in a complex arrangement,
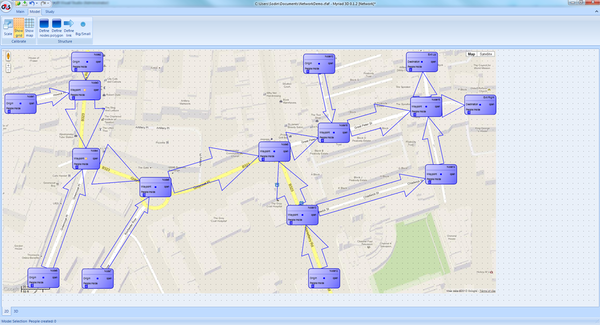
Above - when modelling the boxes indicate all the runtime parameters. Below - when running the model we switch these to "tiny" mode.
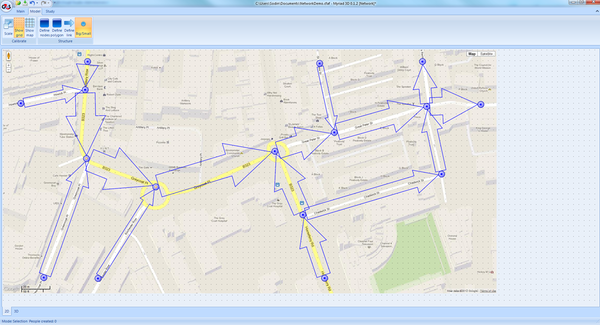
Below - model running - the gradients on each arrow (network links) show the increasing demand on the nodes (the intersection).
Below - as the model continues to run we have visual indicators of queue build up in complex spaces. A mouse click on a link will bring up the pop-up information box (and graphs). The data is saved for detailed analysis.
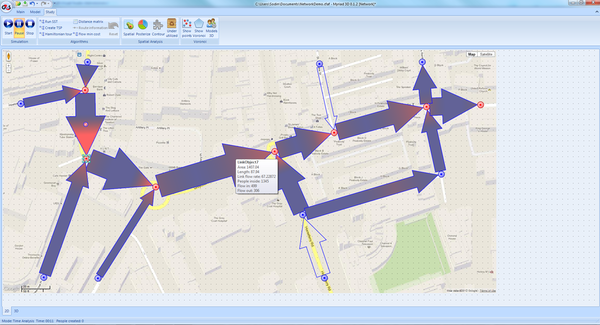
Below - the model allows the user to set timers (management controls - stop/start) to see how quickly queues build up in the system.
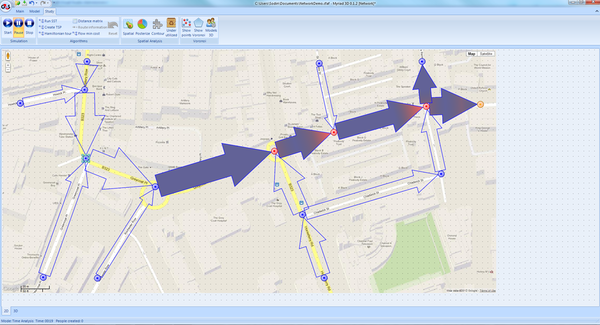
Above - when we use the tool to assess a crowd management strategy - different strategies can be tested for crowd accumulation and queueing delays. Below is the integrated network/spatial analysis tool developed to perform a range of crowd risk and value engineering analysis.
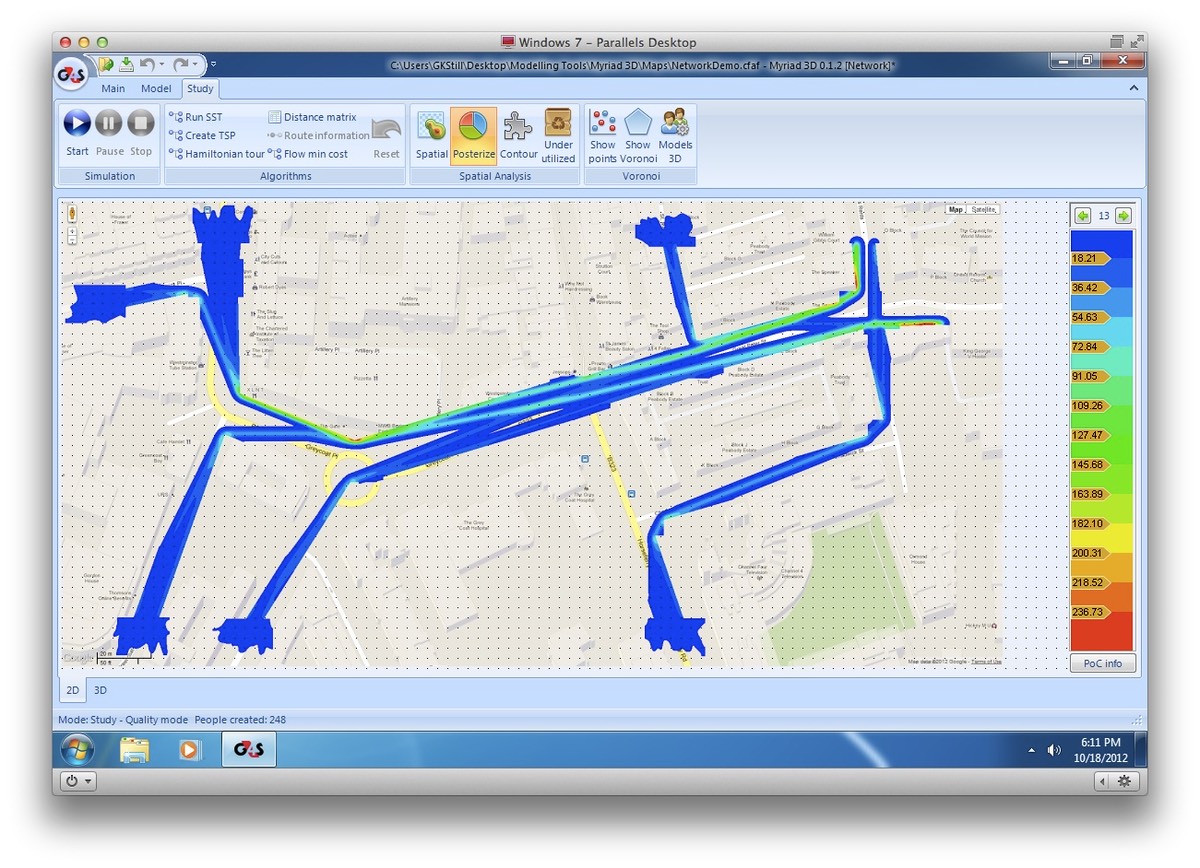
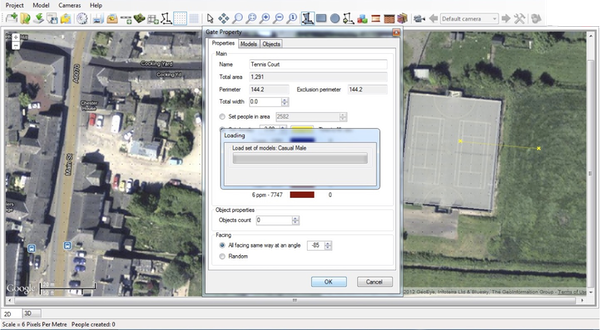
Below - the models can be viewed in 2D and 3D (below a simple model of an event space (local tennis court) used as a viewing area for a fireworks display (to the far right below).
We can test queuing delay on approach, time to fill, crowd build up (density), crowd delays and time to evacuate the area.
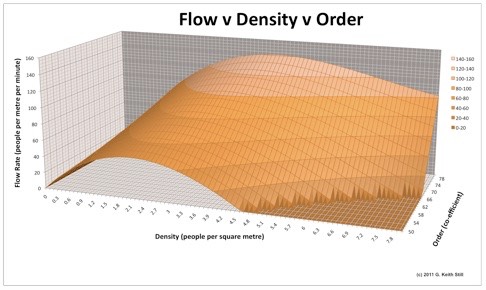
As density increased flow increases, but only until critical density is reached (2-3 people per square metre). This critical density can be different for different events/crowds.
As density (people per square metre) increases above the critical density the crowd flow rate begins to drop. Crowd flow is also a function of the crowd order. For example, armies marching can achieve a greater flow rate at higher densities than a mixed demographic crowd. Order in the crowd can increase the capacity density as the graph below indicates. This relationship (flow v density v order) is the basis of the new crowd flow algorithms in the above modelling environment. This allows a much more versatile and comprehensive analysis for a wider range of demographics.