2 Introduction
In this chapter we discuss the problems of crowd dynamics and the fluid analogy using areas of Wembley Stadium to illustrate various crowd safety features.
2.1 Keeping the crowd out of danger: an overview
Designing an effective evacuation (egress) strategy for places of public assembly is a formidable problem. Every building is unique and operational efficiency during emergency egress cannot be fully tested until a real crisis occurs. Therefore the challenge is in anticipating the problems that may occur during an emergency, especially where they relate to the complexity of human behaviour.
(Update 2011 - the challenge remains. If you review the number incidents since this publication and explore the underlying causes you find that the the majority are due to a lack of understanding of the basics - flow rates, fill times, capacity and arrival/departure profiles - we will explore those in more detail in these updated notes through the reset of this document).
If the design could be constructed in advance, it would be possible to perform qualitative and quantitative risk assessment by destructive testing. Unfortunately it is not feasible to test every layout for every possible scenario. It is also unethical to expose people to real emergencies in order to analyse their behaviour and reactions.
There is a saying in the industry “To ignore the danger is to deserve the disaster.” Computer simulations are one method of addressing the problem. A range of network flow, crowd and egress analysis systems are available on the market. They are all useful, but no single system provides a comprehensive range of scenario testing for safety engineering purposes. Many treat human traffic as blocks of uniform individuals moving as one. Some systems use the mathematics of fluid dynamics to predict human flow patterns. Some systems are based on assumptions that are fundamentally flawed.
(Update 2011 - these still exist and provide not only a misleading, but also a very dangerous basis for site analysis. For examples systems that show crowd movement about 5 people per square metre fail to highlight that at those densities there is an much higher risk of crowd crushing, trips/slips and falls and the potential for the crowd to exhibit shockwaves - violent movements that can, and do, cause serious injury. The various international guidance on the safe crowd density all indicate that above 4 people per square metre there is significant risk of the above. However this fact is not always highlighted by the people who both sell these simulations and who use these simulations in there chargeable services. If you use a modelling service or a simulation, take care to check the credentials of the modelling and the application of the modelling tools).
Furthermore, the present guidelines have inconsistencies which can lead to misinterpretation. These need to be highlighted and an alternative methodology used.
Update 2011 - there are STILL inconsistencies between the Guide to Safety at Sports Grounds, the various fire and safety guides and the building codes. The section in the green guide that shows the analysis of networks is specifically misleading.
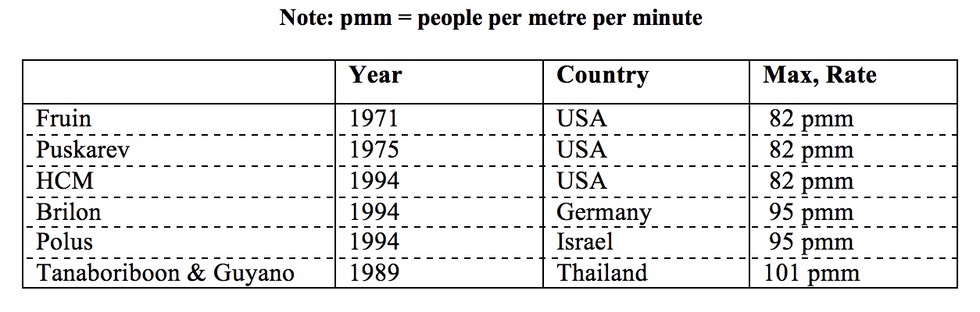
2013 Update - I'm still surprised at the number of people around the world who use older Guides - specifically referencing the 109 people per metre per minute. This value, in light of international research, was adjusted DOWN to 82 people per metre per minute to bring the Green Guide - 5th Edition - in line with the rest of the world - the table below illustrates that value can differ - indeed will differ - depending on the nature of the crowd, event and measurement criteria. However for sustainable, high density crowd flow, there needs to be a "competent" person utilising these value both in design and in operations.
The objective of this research was to develop a model of crowds, specifically aimed at the issues of, and to define numerical standards for, crowd safety.
Update 2011 - the emphasis is the definition of numerical standards for crowd safety (code of practice). We have defined these in the graph shown on this link - Flow versus Density.
We chose to study stadia as they have been part of our culture for the last four thousand years. Why we need a tool for assessing crowd safety is highlighted by the following catalogue of disasters from around the world.
2.2 A catalogue of catastrophes
There are inherent dangers associated with every large public gathering. Every year there are reports of .overcrowding and crushing incidents from around the world To put the problem into perspective, the following list highlights just some of the events that have ended in tragedy.
1964 - 300 die in a stampede after goal disallowed, Olympic qualifying match. Lima, Peru.
1968 - 74 died when a crowd stampeded after burning paper was thrown onto terraces. Fans head towards a closed exit and are crushed against the doors. Buenos Aires.
1971 - 66 died when barriers in Ibrox collapse during football match. Glasgow, UK.
1974 - 49 trampled to death as crowds break barriers. Cairo.
1979 - 24 died and 27 injured in a stampede as fans stampede during a light failure. Nigeria
1981 - 24 died in a stampede as fans rush to leave ground. Piraeus, Greece.
1981 - 38 injured during a crowd surge at Hillsborough Stadium. Sheffield, Great Britain.
1982 - 340 died at European Cup Match between. Incident occurs when fans, leaving stadium, try to re-enter after last minute goal. Moscow, Russia.
1982 - 24 died and 250 injured in a stampede, caused when drunken fans provoke a stampede. Cali, Columbia.
1985 - 10 died and 29 injured trying to force their way into a stadium. Mexico City.
1985 - 39 died at Heysel Stadium when riots break out and wall collapses. Brussels.
1988 - 70 died in stampede towards locked exits in a hailstorm. Katmandu, Nepal.
1989 - 95 died when police open gates to alleviate crowding. Hillsborough, Sheffield, UK.
1990 - 1,426 died in stampede in overcrowded pedestrian tunnel. Mina Valley - North East of the Jamarat Bridge, Saudi Arabia.
1991 - 40 died along fences when fans try to escape fighting. Orkney, South Africa.
1992 - 50 injured falling from upper tier of Maracana Stadium when part of the fence gave way when 150,000 fans await the Brazilian championship final. Rio de Janerio.
1994 - 270 died in a stampede during “stoning the Devil” ritual. Mecca, Saudi Arabia.
1996 - 83 died and 180 injured at a World Cup qualifying match. Guatemala City.
1998 - 150 Muslim pilgrims crushed to death in a stampede. Mecca, Saudi Arabia.
1999 - Jan 15th - 51 Hindus killed and 100 injured in a stampede after part of a shrine collapsed. Over 1.5 million present at ceremony. Kerala, India.
1999 - May 31st - 54 dead, 150 injured, 78 hospitalized when a crowd of 2,500 rushed to get out of the rain at the railway station. Minsk, Belarus.
2000 - June 28th - 8 trampled to death at rock festival. Roskilde, Copenhagan, Denmark.
2000 - July 12th - 12 die, dozens injured as crowd flees from police tear gas. Harare, South Africa.
2012 update - sadly many more incidents have occurred since my original thesis. This update table below is only SOME of the international disasters since the publication of my original thesis. A more complete list is on this link
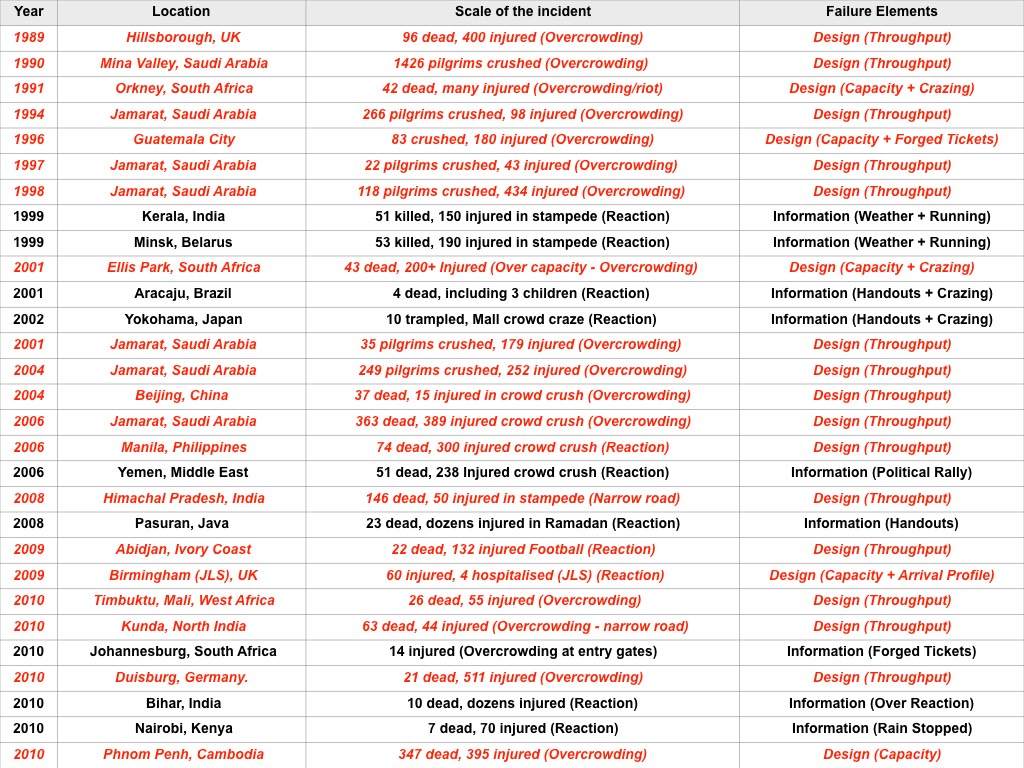
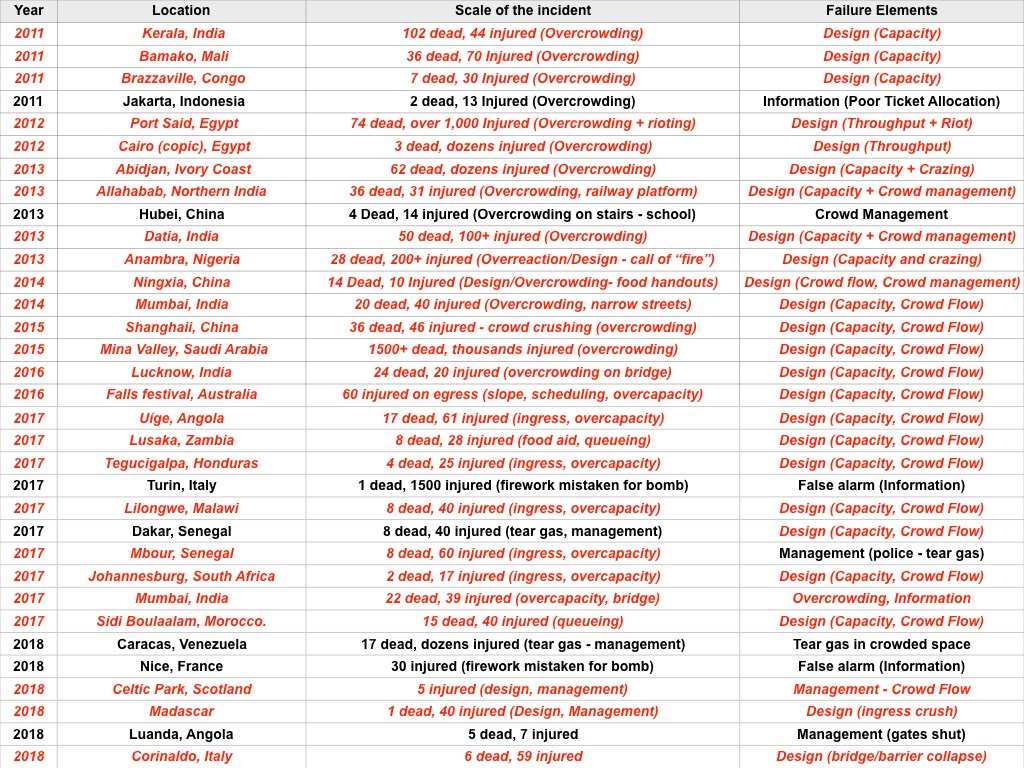
Update 2013 - I've highlighted those that have design issues as the fundamental (or Distal) causality. This highlights that the numerical analysis of flow rates, fill times and capacity are potentially the primary elements where improvements to crowd safety would have most impact. With this type of analysis my work has focussed on developing educational programs to improving crowd safety through the principles and applications of numerical techniques - not involving computer simulations. Although this was clearly defined in the original thesis - see notes above - it's still the single most important element to improving crowd safety.
Update 2017 - the list continues to grow and we see the same repeating pattern of causality (poor understanding of crowd dynamics)
2.3 Gate C
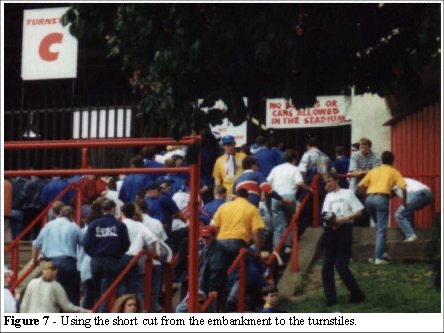
Crowd behaviour can be anticipated, even when it appears counterintuitive. Figure 4 shows the top of the stairs at gate C of Wembley. There is a gap in the fence where supporters can take a short cut by walking up the embankment and ducking under the hand rail (Figures 5, 6 and 7).
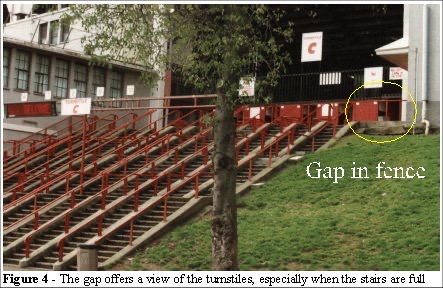
The view of the short cut is shown in Figure 4, as seen from the approach to gate C along the main concourse. As the crowd occupies the grass embankment (Figure 6) it is natural for those people simply to use the available gap in the fence as a short-cut (Figure 7). This exploitation of a short cut is a least effort behaviour.
Update 2013 - many researchers have utilised the principle of least effort defined here. In the original algorithms this was achieved by the modeller defining the routes then the agents using a two stage scanning algorithm to way find. The current algorithms and developments use different principle that is significantly faster and does not rely on the modellers interpretation of human behaviour. The current algorithms combined a diffusion mapping process with a superposition of multiple trails all based on coupled local heuristic algorithms.
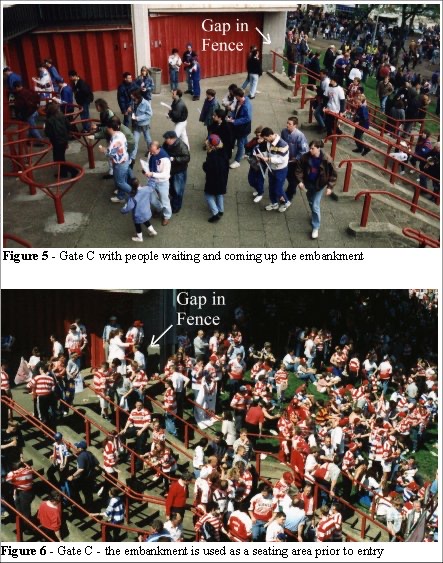
It was noted that a few people cutting through this gap can effect the movement of the people on the stairs. In 1992 the author stood in the stair queue for four hours while a stream of people moved up the embankment to gain entry. The area on the upper stairs, in front of the turnstiles, is 15 by 7 metres (105 square metres) and counts of 400 to 500 people can be observed during a typical ingress.
Between 3 and 5 people per square metre are typical of the normal ingress density.
Update 2013 - this can depend on the local conditions and geometry. Over the last decade there have been a number of incidents that are due to the organisers failing to understand the ingress process, the required spaces for the crowd and maximum safe density for that process. Again this highlights the need to better educational programs and specifically the need for a defined standard and levels of competence across the industry.
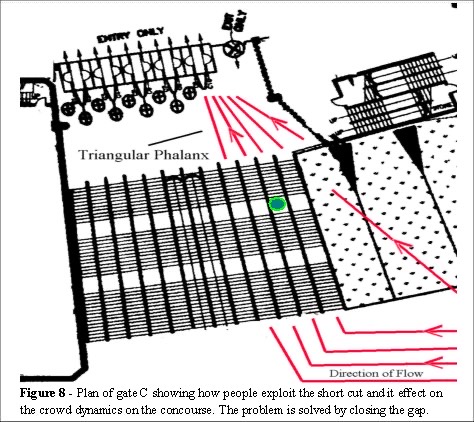
When patrons exploit the short cut under the railing, a triangular phalanx forms which pushes toward the turnstiles (Figure 8) this impedes the flow of patrons on the stairs. The phalanx creates a lateral pressure across the top concourse, pinching off the crowd flow up the stairs. The problems are: how to assess the impact of this flow, and how to optimize the crowd dynamics for these turnstiles. The answers lie in understanding the nature of crowd dynamics.
2.4 The players’ tunnel
Between B and C turnstiles there is a tunnel where the players enter the stadium (bottom left in Figure 8). This area is a focus of attention when the team coaches arrive. The crowd is held clear of the road by police horses. When the coaches pass into the tunnel the horses move aside and the two crowd, to the left and right of the tunnel, flow past by each other. The crowds can be seen in Figures 9 and 10.
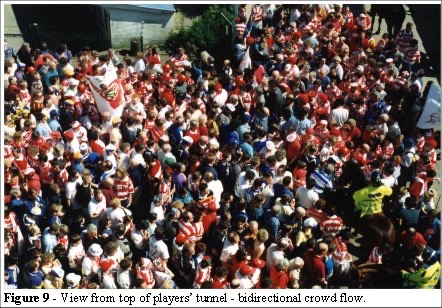
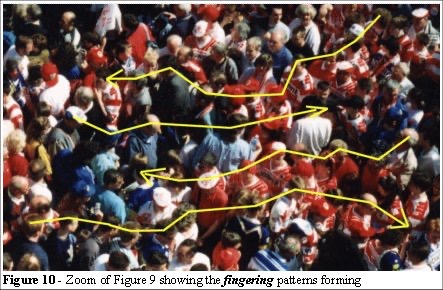
In this high density crowd movement we observe the phenomenon of self-organized, bidirectional, flow. Where two opposing flows self-organise into long chains of people passing each other, like conga lines at a party, flowing easily through one another - a phenomena unique to interactive systems but not fluids.
Similar patterns are often seen in densely crowded areas. We shall examine how and why this occurs and how they form in crowds in chapter 6.4.7.
2.5 The fluid analogy
After the observations at gate C in 1992 an investigation began into the literature relating to crowd movement and the legislation relating to crowd safety. The literature was sparse, assumptions of average density and average flow were used to indicate safety limits, for example, in the Building Research Establishment document [29]. The papers were inconsistent with the observations!
Crowds are often described in fluid terms, a “sea of people”, “ebbing and flowing like a tide” the language rich in fluid analogies. Egress routes and building designed are based on the fluid flow assumption Flow volume = Average speed x Average density. Also, the assumptions that crowds flow like a fluid implies that the fastest flow is down the centre, as in Poiseuille flow [30]. Yet field observations clearly demonstrate that crowds move more quickly at the sides. Clearly there was a need for further research into the phenomena observed at Gate C.
2013 Update - this is SUCH an important point. The speed is a function of density.
2.5.1 Why is the fluid analogy untenable?
Understanding crowd dynamics is essential for understanding crowd safety. In 1992, at gate C, a small flow of people, coming up along the edge of the queue via a grass embankment, had an effect on the operation of the turnstiles. This small flow effectively blocked the forward motion of the crowd. No such phenomenon occurs in fluids, so there have to be some fundamental differences between crowd and fluid flows. The laws of crowd dynamics have to include the fact that people do not follow the laws of physics, they have a choice in their direction, have no conservation of momentum and can stop and start at will. They cannot be reduced to the equations that are appropriate for the movement of ball bearings through viscous fluids [31].
update 2012 - I've noticed, over the last ten years of teaching around the worlds, that one of the most difficult things for operators to understand is the basic maths. The crowd flow versus density is easily illustrated and I use a piece of string in a loop in classroom exercises to aid understanding. Video clips on this site to show this simple experiment illustrating the flow versus density relationship - link here
Click on the links below for a video clip of:
5 people per square metre (marching in time)
end of update
2.5.2 Definition of crowd density
In the Guides the safety limit for crowd density is defined as 40 people in 10 square metres for a moving crowd and 47 for standing areas. The following problem of a crowd filling an area was highlighted in the Taylor Report [32].
Update 2013 - there is still a persistence in some areas to use the modulo of density, area per person, this is both confusing to the layperson and expert alike.
2.5.3 Crowds find their own levels.
It was assumed that people entering an area will distribute evenly across the available space. The conjecture is that a crowd finds its own level is based on a fluid model of a crowd. This assumption implies that the crowd has complete awareness and behaves in a sensible manner for the benefit and safety of all the individuals in that crowd. It also assumes that individuals in the crowd are free to migrate across the available space. This is not the case when an area such as a pen, front of stage or station platform is filling to capacity; there is little room for the individual to manoeuvre to lower density. In those environments people compete for space.
Update 2012 - this competition for space is still a fundamental failing in a lot of the simulations in the market. There is very little research into crowd pressures. We're currently modelling front of stage pressures at Bucks New University - click here for link
2.6 Two key questions
There are two key questions which arise from the assumptions of crowd behaviour. Firstly, do crowds find their own levels as claimed? Secondly, as previously reported statements indicate, do crowds flow like fluids?
As the initial interest in crowd dynamics occurred at Wembley Stadium, permission was sought, and duly granted allowing the author unlimited access over a two-year period (1994 and 1995). The management team headed by operations director George Wise (now retired) allowed access to available historical video footage, attendance of all the major events for the two year duration of the field study, maps of the local area, plans of the stadium and access to observation points, from which the public are normally excluded, for photographs and observations.
The stadium has a capacity of 82,000 and hosts football, rugby, concerts, greyhound racing and wrestling. All of the approaches to the Wembley area are monitored for a radius of 20 miles (via police cameras situated on motorways) where traffic can be observed and the event can be delayed if necessary.
Although Wembley Stadium has no history of any crowd related disasters, the staff are aware that complacency is the biggest threat to public safety.
2.7 Ingress safety at Wembley
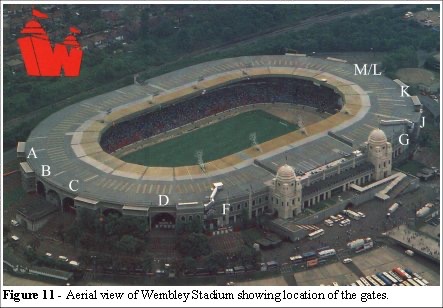
Wembley Stadium (Figure 11) hosts a variety of events. Patrons arrive by a number of means (trains, coaches, cars, and the London Underground system). For sporting events, all of the supporters can arrive in a relatively short space of time (30 - 90 minutes). 30,000 supporters can arrive in the hour prior to kick-off.
To analyze the operating parameters of Wembley it is necessary to study the records of the turnstile computer. This information is recorded. Ingress numbers are printed and a copy is kept as an archive. The computer system also records the flow rates during ingress but those data are available only during the event.
2.7.1 Wembley turnstile data
Every turnstile at Wembley Stadium has a counter which is tripped when a person enters. The final count through each turnstile is recorded.
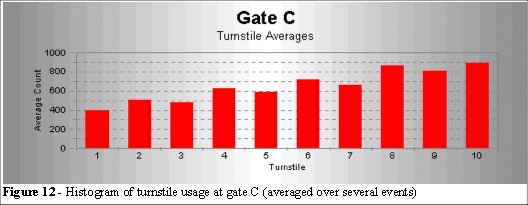
Some data (stored on floppy computer disk) were recovered from previous system tests. Along with the 1994 FA cup final, which was recorded and video taped. Those data are used to illustrate the problems of late arrivals and the impact of changing flow rates. The ingress distribution for the turnstiles for several football events at gate C is shown in Table 1. The usage is not evenly distributed and Figure 12 shows the graph of this distribution.
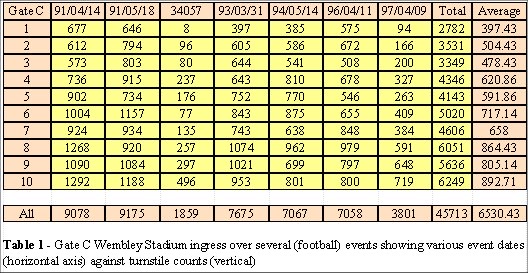
It is clear from the histogram that the turnstiles are not being used evenly. In fact turnstile number 10 has an average total ingress double that of turnstile 1.
The crowd approaches the turnstiles along the concourse (Figures 4 and 8) and the nearest turnstile is 10. We examine this uneven usage in chapter 3.4 (Effects of geometry) in more detail.
2.7.2 Wembley ingress capacity
Wembley Stadium has 10 turnstile groups and 2 gallery entrances. The gates are labelled A, B, C, D, F, G, J, K, L and M and are all operated by turnstiles with entry numbers and flow rates shown on the main computer in the control room. The Olympic gallery entrances are labelled E and H and have a manual ingress count.
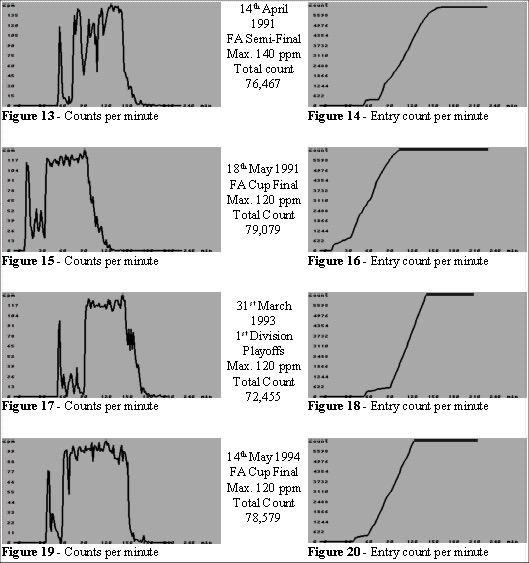
Gates A, B, C, D, F, G, J, L have 10 turnstiles each, M has 8, K has 12 but 11 and 12 are not used. The stadium capacity is 82,000, with an ingress capacity of 660 per turnstile per hour, the total capacity is 660 x 98 = 64680 per hour or 1078 per minute. It would therefore take 76 minutes to fill the stadium given an even distribution of patrons to each turnstile. The gates are opened 2 hours prior to kick-off for football matches. It is clear that ample time has been allowed for orderly, safe ingress. The wide concourses and the stairs leading up to the turnstiles act as passive crowd management aides, by design.
The records for four events are summarized in Figures 13 to 20. These show two graphs (side by side for each event) of the entry counts per minute (left hand graph) and the counts per minute (right hand graph). Both graph types have time across the horizontal axis and start when the gates open. The slope of the right hand graph gives an indication of the entry rates. The important feature to note is the shape of the left hand graph (the initial peak is when the gates open and the initial waiting crowd enters). The plateau shows the majority entering. The gap between the peak and plateau indicates the differences in the walk-up (the name given to the mass of fans arriving close to kick-off) and those patrons who arrive in good time for the gates opening. Two other noteworthy features are the slope on the tail end of Figures 13, 15 and 17 compared to the sharp drop for Figure 19. This indicates that there were more fans entering at a higher rate closer to the kick-off time.
This effect distorts the averages and a number of the turnstiles exceed the entry rate limit of 660 people per hour. This indicates that a potential problem exists but is hidden in the data. If we average the peak flow over the duration of the peak flow we find that many turnstiles are operating at a flow rate > 800 people per hour. 14th April 1991.
Update 2016 - recent recordings of modern technology for a major stadium are recorded at 750 people per turnstile per hour.
It is worth noting that these graphs were obtained by taking a series of screen grabs from the turnstile computer system. The process involved taking a copy of data from the main computer (not automatically saved) after the event, and running it on a different computer to obtain the graphs. It was not possible to extract this data from the archived materials kept at Wembley Stadium in a single process. The same system is still in operational use and the flow rates are not recorded or analysed for trends in arrival patterns.
Update 2012 - the stadium closed in October 2000, and was demolished in 2003, rebuilt and reopened in 2007. This analysis refers to the old Wembley Stadium during my research years of 1993-1996
2.7.3 G and J turnstiles
When the concourse area is empty, the perception is that the area has ample space for crowd circulation.
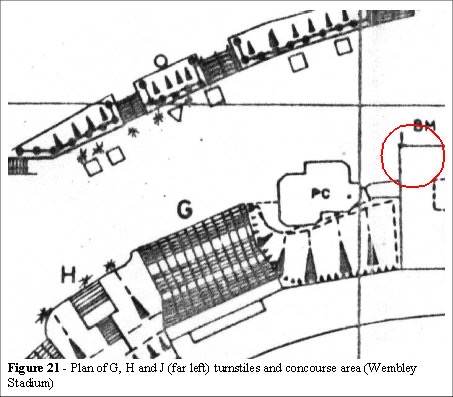
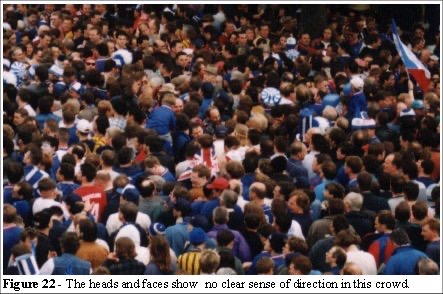
The main line railway station is to the left of Figure 21, the car parks are at the top of the plan, and the tube station is to the right of the plan. The area in Figure 21 is the most congested area of the Wembley concourse. It measures some 23 metres in width. From a vantage location, circled in Figure 21, the scene in Figure 22 was found to be typical of a normal crowd ingress to the stadium.
The concourse area by G, H and J turnstiles is multidirectional with crowd flows from both left and right (car parks at either side, underground and main line railways). There are toilets below the walkway (entrance to the Exhibition Hall), and there are a number of concessions (hot dog stands, merchandising, etc.). Concession stands lead to queuing and interferes with the overall crowd flow. G, H and J turnstiles are of concern due to the congestion on the concourse in the illustrated areas. The flow patterns and crowd dynamics in this area appear chaotic.
Crowd sway, when a congested crowd moves from side to side, can lead to problems. The edges of the crowd, in a confined space, can reaches high density and supporters are in danger of being injured by being crushed against any solid walls.
Update 2012 - again this highlights the potential pitfall of some computer simulations. They do NOT show this as a risk. Many simulations, in order to overcome a high density packing and movement issue, show an uninterrupted flow at high density. This is clearly misleading as there is significant risk at high density due to the crowd sway and potential for shockwaves.
As Figure 22 shows, the crowd is very tightly packed. It can be seen from the way that the heads are facing that there is no clear sense of direction. Should there be a need to clear this area there is no identifiable egress route. Yet, at densities of 5 to 8 people per square metre - the crow still flows in a bi-directional manner.
Update 2012 - which is why some computer systems struggle to emulate this behaviour. The human body comes in a wide range of shapes and sizes, people push and squeeze through crowds, complex patterns of movement are observed and very difficult to model. However the main theme of this thesis was, as previously stated, to develop a model of crowds, specifically aimed at the issues of, and to define numerical standards for, crowd safety. In simpler terms, The objective of this research is to develop standards for crowd safety.
2.8 Wembley Complex Station
The Fire Services College prepared a guideline for existing rail surface stations [35, 36] which echoes the Guide recommendations of egress rates:
No. of Units of Exit Width = Number of Persons (1)__________
required (each width = 0.55m) Flow Rate (2) x Evacuation Time (3)
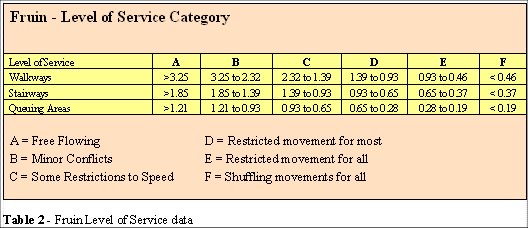
Where number of persons (1) means the maximum number of people that could be expected to be on a platform at any time. Flow rate (2) means 40 persons per minute for escape routes incorporating stairs, and 60 persons per minute for level escape routes (without stairs). Passenger walking speeds should be assumed to be 38 metres per minute for horizontal circulation. These figures are based on research by John Fruin [6]. Table 2 indicates the square metres per person related to this Level of Service category. We question these assumptions in chapter 3.2.
Update 2011 - the challenge was due to the assumption that egress is based only on travel distance and a steady walking pace. At densities greater than 3-4 people per square metre this is variable. Furthermore the nature of the potential alert - bell, PA announcement and/or presence of a threat/smoke all have significant impact on the initial start to move times. Click here for a flow/density analysis.
Evacuation time (3) is derived from the Green Guide, which takes into account the maximum flow rate figures, the provision of fire safety measures, and emergency exit routes.
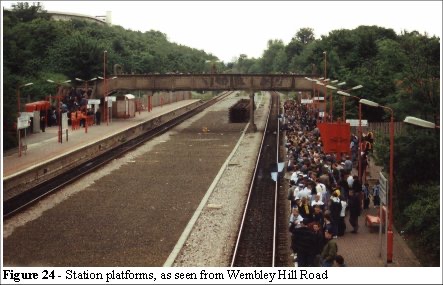
The maximum capacity of a train coach will not generally exceed 100 persons. The platforms are serviced via two bridges from Wembley Park Road (left and right of Figure 23 and in background of Figure 24). The left-hand bridge (Figure 23) is a pavement/road whereas the bridge (Figure 24) is a footbridge only.
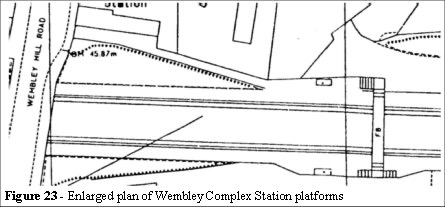
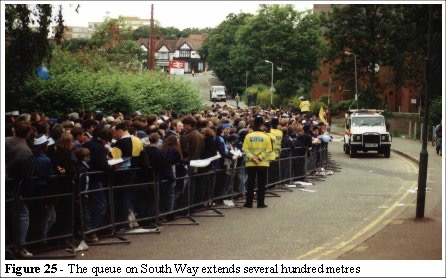
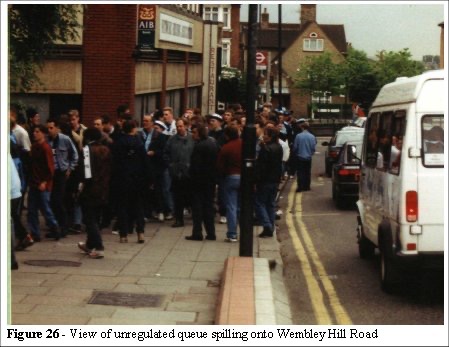
South Way can be seen in Figure 25. It runs from the Wembley Hill Road to the stadium. During egress on 28th May 1994 South Way was full of supporters, jubilant after their resounding victory; spirits were high and a party atmosphere prevailed. Had they lost, the behaviour of this group would have been different. Supporters who do not want to queue on South Way can walk round to the other platform entrance, via Wembley Hill Road. The narrow pavement and lack of crowd management measures, temporary barriers, or police monitoring, mean that queuing supporters spill over the pavement and onto the busy road (Figure 26).
2.9 Why we need something different
From the initial observation of the unusual crowd movements at Wembley Stadium several models of crowds were created. Initially built in a virtual reality environment, these proved to be computationally limited due to the time it took to calculate the collision detection of the virtual objects. This led to an extensive literature search and discussions with the authorities from the local fire officers, architects, design engineers, safety consultants, consulting engineers, the home office, the fire research station, the building research establishment and the construction directive.
These investigations raised further questions about the nature of crowd dynamics, and directed the objectives of the research programme. This initial work was followed by two seasons of crowd study, again at Wembley, in which the nature of crowd safety began to direct the course of development.
The field studies proved the contradictions of the fluid analogy as we can see from the photographs of Wembley Complex Station. On the platform (Figure 24) there are sections of the platform (bottom right) that are empty, where the area in the middle is more densely packed. Yet the crowd outside the station appears to follow the fluid analogy where the crowd is “finding its own level.”
2.10 Analysis of the Hillsborough disaster (1989)
One of the worst disasters in British football history, where the crowd failed to find its own level, occurred at Hillsborough Stadium on April 15th 1989. Hillsborough had hosted similar FA cup semi-final matches, without incident, many times before. This included the same fixture between the same two teams the previous year. The circumstances that led to 95 deaths and over 400 injuries highlight the lack of understanding of the nature of crowd dynamics in these environments. They also signified a turning point in the attitude of management to safety, for the first time putting greater emphasis on human factors. The Archbishop of York said this at the Hillsborough memorial service.
"Events of the magnitude of Hillsborough don’t usually happen just for one single reason, nor is it usually possible to pin the blame on one single scapegoat... ...Disasters happen because a whole series of mistakes, misjudgements and mischance happen to come together in a deadly combinations."
Update 2013 - following a decade of disasters there appears to be a more fundamental problem relating to overcrowding. The root, underlying or distal causes of accidents and incidents appears to be the design limits are simply not understood. Over the last decade I've noted that the majority of incidents have, at their heart, a lack of understanding of flow rates, fill times and safe capacities. "A series of misjudgements, mischance and mistakes" to paraphrase the Archbishop of York is not the cause - it's a basic lack of training to understand the situation and how overcrowding develops. This needs to be addressed as there are still no formal qualifications required to fulfil the role of a "competent" person who's job it should be to assess crowd safety in complex and built environments. A crowd model is the core of the crowd management plan, by that I do not mean a complex crowd simulation - simple modelling techniques have proven time and again to be sufficient to understand risk. I explore this important difference and application later in these updates and throughput this website.
Update 2016 - after two years of evidence in the Public Inquiry, the verdict of “Unlawfully Killed” was returned by the jury.
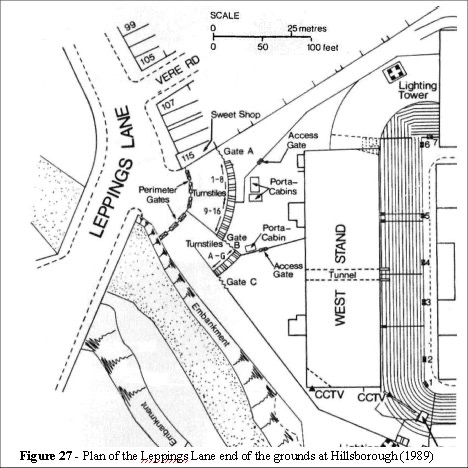
It is not difficult to reconstruct what happened at Hillsborough. 24,000 Liverpool fans approached Hillsborough from Leppings Lane. 10,000 of them would make their way to the terraces (behind the goal) which were serviced by seven turnstiles. The late arrival of the fans created a dangerous crowd build-up by the perimeter gates. There was no single factor that led to those late arrivals and within 20 minutes the problems of crowd density, and hence crowd safety, became unmanageable. Approximately 5,000 fans were in danger of physical harm around the perimeter gates and turnstiles in Leppings Lane. In an attempt to relieve the pressure at the turnstiles, the police opened the exit gates (gate C - Figure 27) allowing 2,000 additional fans into the ground and towards pens 3 and 4 which were already full.
The crowd approached the perimeter gates from the narrow bottleneck in Leppings Lane and the area was engulfed. In previous years, a line of police horses was used to filter fans at the perimeter gates. This was to ensure that fans without tickets did not enter the area and create a problem at the turnstiles. It was speculated that had this exercise been repeated the disaster might have been averted.
2.11 Conclusion
The disaster at Hillsborough and the observations at Wembley, gate C, J/G turnstile, and Wembley Complex Station, directed the main focus of research toward the safety of the individual in the crowd, for example protecting them from high density crushing. The catalogue of disasters serves as a warning against underestimating the enormous forces at work in high density crowds.
update 2012 - Never underestimate the enormous forces that can develop in crowds.
The Hillsborough disaster illustrates the problems which can arise through lack of understanding, poor design and bad operational planning and management.
The Taylor final report [32, 33, 34] highlights the need for this research:
"... tests can only be carried out by using real spectators. Bank computers and other computer technologies can be tested by putting through figures, data and printout. But the system can only be tested by putting through people. So in the very testing of whether the system may cause danger, danger may be caused."
Observations of how local geometry can affect the crowd can be seen in the movement and packing configurations on any busy station platform. The crowd did not find its own level. So, that respect, it does not behave like a fluid, either in motion or in nature. Yet, a few metres away, the behaviour of the crowd was fluid in nature exploiting the weakness in the management system along South Way and Wembley Hill Road. As a result the crowd appears to exploit the space and the routes which were not appropriately managed. This exploitation can be explained as a collective behaviour emerging from the individuals propensity to expend the least effort to reach their objective. In this specific example it is less effort to walk a longer distance to reduce the overall time to get home (including queueing for the train).
2013 update - this was understated in 2000. The local heuristic and the wide are heuristic both follow paths of least effort. In physics this is defined as the path of least resistance. Where biological, decision making entities are involved the information in the environment, such as local knowledge, leader/follower behaviour, "he looks like he knows where he's going - let's follow him" and signage, maps, plans, twitter/facebook all add an important dimension to those choices.
Density is not evenly distributed across areas of limited space. We shall examine the relationship of local geometry in more details in chapter 3.4 where we will look at the turnstiles around Wembley.
The objective we have set for ourselves is to determine the critical factors involved in crowd dynamics and crowd safety in places of public assembly. Specifically, the objective is to use the simulation tools to provide the user with a flexible “what-if”system to experiment with, test and educate themselves in the nature and problems associated with crowd dynamics.
Using such a simulation to supplement the existing legislation and building guidelines, to test various crowd parameters in a safe and thorough manner, is the ultimate goal. We can make the environment safer by design and test the limits of safety by using a range of tools including the simulation system.
2013 update - I've developed a lot of simulation tools over the last 20 years; VEgAS, Legion, Myriad I and II, Shepard, the Paramics UAF, however the biggest gains have been found in meta-modelling. I use much simpler modelling process and teach the basic principles for site and event modelling using very low cost, easy to apply, techniques aimed at the operational end of crowd risk management).
The goal of the research is to improve all aspects of crowd safety through the use of a computer simulation and an appropriate methodology. To achieve this we have to understand the problems associated with computer modelling of both the dynamics and the behaviour of crowds.
2013 update - it was the methodology, DIM-ICE, the definition of meta-modelling events and the development of robust crowd management plans that are proving to be more useful since they are aimed at the operations teams and not the specialist computer modeller.
Chapter 4 - Principles of a simulation
Chapter 5 - Legion (agent based simulation)
Chapter 6 - Validation of a computer model
Chapter 7 - Case study 1: Balham Station