3 Introduction
In this chapter we examine the present crowd and pedestrian planning tools, the existing body of literature, and the applicability of present techniques. Further references to the Guides and the work of John J. Fruin are examined in detail. We also highlight the dynamic effects of geometry on the crowd. We introduce how network analysis tools are used in the guidelines, Braess’s paradox and the problems with the Green Guide network analysis are introduced and compared.
3.1 John J. Fruin - pedestrian planning and design
John Fruin researched crowds in the early 1970's. His book Pedestrian Planning and Design [6] has been cited in many of the present guidelines for pedestrian planning. This research has become the standard for many subsequent building design and planning operations. References to Fruin have been universally accepted. Fruin states, in his book [6]:
The ideas expressed therin should be tempered by recognized engineering practices, guidelines, codes and standards.
Fruin, more than any other individual, has defined the criteria for safety standards in places of public assembly. He defined the level of service concept where the density and speed relationship are stated as guidelines for comfort and safety. It is important to note that Fruin made his measurements in a pedestrian street environment. Crowd behaviour on a city street with its many distractions is quite different from a stadium behaviour, and very different to emergency egress behaviour. The modern stadium has crowd densities in excess of the Fruin observations and therefore the application of Level of Service needs to be examined.
Update 2012 - we still find that operators are left with the problems of having to "make it work on the day" due to a lack of understanding that the Level of Service concept is difficult to understand. This is partly due to the area per person and the American measures of feet person and feet per second - we typically adopt a simpler approach to the concept using density. People per square metre is easier to visualise, square metres - or feet - per person is less easy to visualise, metre per second, people per minute.
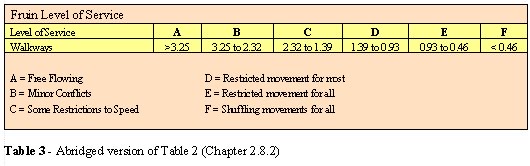
3.1.1 Fruin level of service (LoS)
The following paragraph is paraphrased from Fruin [6 - page 19].
Body depth and shoulder breadth are the primary human measurements used in considering pedestrian spaces and facilities. Shoulder breadth is the major factor in the design of doorways, stairways etc. Many portals are designed to allow two or more persons to pass through abreast but actually have insufficient width for this purpose.
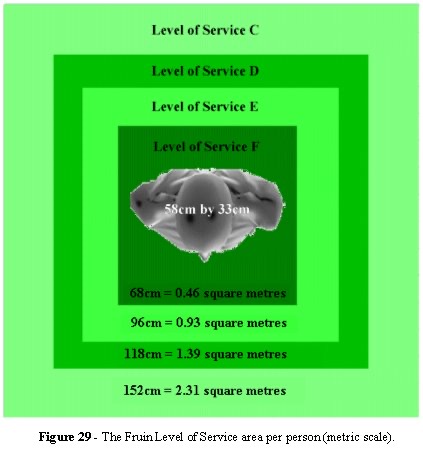
We examine the Fruin data and find that his measure for a fully clothed male labourer is 22.8 inches by 13 inches (57.9cm by 33cm). The author is 6 feet 3 inches (190 cm) tall, sturdily built (some may say overweight) and is larger than the average individual with a breadth of 53cm and depth of 28cm. Figure 28 shows the comparison of the Fruin body size and the author.
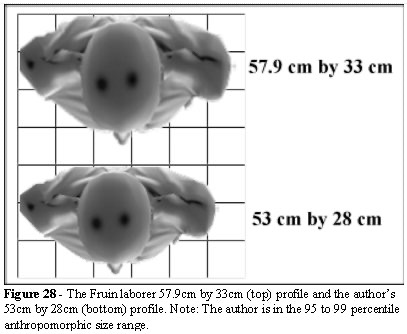
The Fruin data appear to be generous, but we have to remember that the environments Fruin measured, and applied his level of service calculations, were predominantly city streets. There is no doubt that if the space is available then his guidelines represent ideal conditions. However, in the modern stadium space is a premium and crowds can accumulate beyond the measurements made by Fruin.
Fruin goes to great lengths to describe the applicability of his data and the LoS, but many users take the LoS as a de facto standard without consideration of the local environments. Body sizes differ and this needs to be considered for high density environments, in particular ingress and egress periods.
3.1.2 Anthropomorphic tables
Anthropomorphic sizes for a large cross section of the world’s population were obtained from a database used by the US Standards [38] and are shown below:
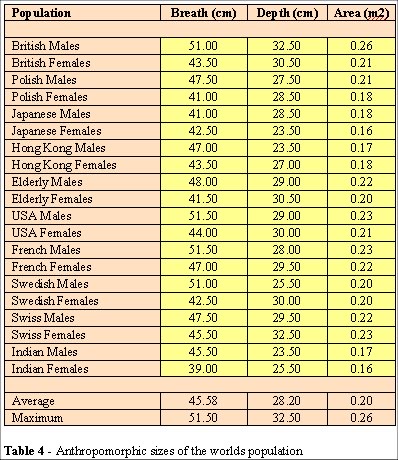
The 95 percentile means that in any given population 95 percent of that population will have dimensions less than or equal to the figures given above. These apply to the unclothed individual. Fruin made the assumption of adding 1½ inches (3.81 cm) to the breath and width, to allow for heavy clothing. This appears to be an overgenerous allowance.
(update 2012 - of course this errs on the side of safety, however the "army of engineers with 10 decimal place accuracy" do little to address this issue. From a private correspondence with Dr. John Fruin.
"My curves are necessarily and mathematically lower than others because they represent class averages, which significantly reduced scatter and resulted in the smooth fit. This was not a problem for me, considering the audience I wanted to address. I had no idea that there was an army of Fire Protection Specialists and others who were more interested in results to the decimal point. (An "unhuman"objective that is impossible to attain.)"
I completely agree with Fruin in the above statement - class averages for pedestrian planning and design, Level of Service curves and the appropriate application of fluid dynamics is an adequate tool in the hands of an experienced user. For example, the dynamics of shockwaves in fluids can be applied to the shockwaves that pass through a crowd and is a perfect example of how fluid dynamics can be used to analyse how pressures can build at the front of stage and in complex geometries. However, this fundamental principle eludes the vast majority and the work I've focussed on in the last decade is based around the principle "how can I make this easier to understand by the layperson?".
My PhD thesis focussed on the analysis of "how and why" large crowds in complex spaces can fail, often with catastrophic results, and in cases where the simple fluid analogy does not apply to crowd dynamics (such as choice of exit). A good design engineer using the appropriate tools and methodologies applied in the appropriate manner does not need sophisticated simulations to construct safe environments.
Sadly, as Dr. Fruin points out "an army of Fire Protection Specialists and
others who are more interested in results to the decimal point. (An
"unhuman" objective that is impossible to attain.)" Furthermore
this "army" relies on poorly built, poorly applied and poorly calibrate computer
models to "validate" their environments to the Nth decimal place.
As the joke (from Fruin) goes "What these engineers with their 10 decimal place CAD systems forget is that we build this stuff with big yellow bulldozers."
The elements of crowd dynamics with respect to crowd safety is to understand the limits, boundaries and safety margins of large numbers of people in complex spaces. The Fruin Level of Service, as used and applied to pedestrian planning and design, has remained a reliable standard for engineers around the world. Sadly, it is not always applied by engineers who understand crowd dynamics and the basic principles of engineering for crowd safety).
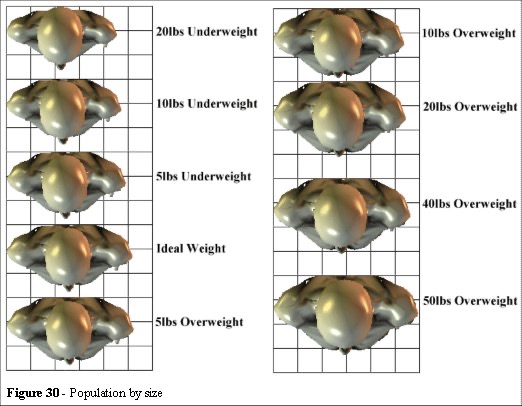
When these dimensions are drawn on a grid, we can determine the average areas, in 10cm squares (Figure 30). Taking a 50cm by 30cm profile, ideal weight, we can illustrate the Fruin LoS-D on a marked grid of 10 cm squares (Figure 31).
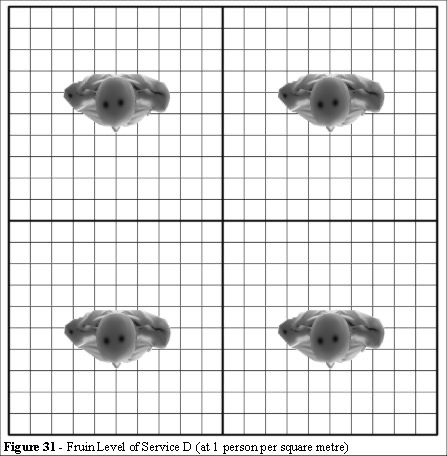
Fruin claims this represents restricted movement for most pedestrians. Observations at Wembley Stadium of crowds of much higher density contradicts this observations. The reasons for this apparent contradiction are found in the relationships between the people and the local geometry, and the relationship of the speed distribution, of the individuals in the crowd, to the crowd flow volume. People do not all move at the same speed and hence complex conflicts arise.
The relationship between speed and density is a complex dynamical problem. It includes parameters relating to human decision making in a variety of densities.
(2012 Update - the relationship is density, homogeneity and flow. An army marching, or city gents walking in step on a commuter line - standing and moving crowds have different spatial requirements)
3.1.3 Field observations contradict Fruin
The video footage from the Hillsborough disaster [39] shows 2,000 spectators flowing through gate C at a fast steady walk. This is confirmed in the Taylor Report [32, 33, 34]. The width of gate C is 4 metres. This gives the average flow volume of 100 people per metre width per minute. A fast steady walk is approx. 1.3 metres per second the density would be in the order of 1.28 people per square metre or LoS-E. As this is indicated as “Restricted movement for all” according to Fruin, there is an inconsistency in the reported and recorded speed density relationship.
Densities of 4.7 people per square metre are typical in and around Wembley Stadium. We can see (Figures 9, 10 and 22) there is space to manoeuvre at LoS-D. Although such crowds are congested, movement is not, as Fruin suggests, virtually impossible [15, page 78]. The phenomenon of self-organisation gives the lie to the Fruin assumption. Furthermore the Green Guide [1, 2] indicates 109 spectators per metre width per minute, and this presents a very different relationship between crowd speed and crowd density.
2013 update - Fruin data, measured in a pedestrian environment, is perfectly acceptable for that environment. However, different environments can have different speed/density relationships - such as city gents on the London underground. This is due to the "marching in step" relationship - see links below for a series of video clips that outline this relationship.
These links are short video clips of a workshops experiment I run to illustrate the relationships between crowd density (people per square metre) and crowd flow (people per metre per minute). As density increases the crowd flow rate drops. This is essential to understand when planning for crowded spaces.
The 109 people per minute has also proven to be spurious and withdrawn from the 5th Edition of the Green Guide, replaced with the Fruin values of 82 people per metre per minute. To understand why this 109 people per metre per minute value was used you need to go back to the original research, the source of the data. This shows a peak of 109 people per metre per minute. 109 (and higher) are possible under certain conditions. Later in the thesis I examined the 120 people per metre per minute values observed, for short duration, at London Underground and that is the key to understanding these values. 109, 120 these are transient, short duration, flow rates and not sustainable.
The importance, and one that needs to be stressed, is that the model MUST be able to emulate this type of phenomena, short duration, high flow rates.
Five people per square metre (walking in step)
Flow versus Density (animated graph)
3.1.4 Fruin Density v Speed
In Pedestrian Planning Fruin draws the following graph (Figure 32)
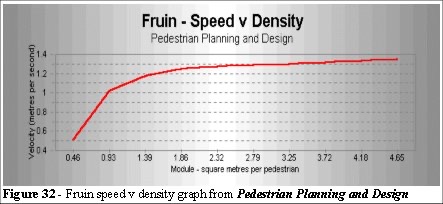
On the basis of the Fruin LoS, the conclusions are that the crowd exhibits marked speed reduction when space around a person is less than 1 square metre. This is true of a random, nondirectional crowd, such as one would find in a shopping mall or busy city street. Fruin has observed several situations in which his LoS does not apply and explains his findings as follows [15 - page 45].
Reportedly, marching soldiers in precise military formation, each occupying about 6 square feet (0.56 square metres), can attain flows of 48 pedestrians per foot per minute (157 people per metre per minute) for the width of the formation. However, normal pedestrian flows cannot maintain the precise cadence and area occupancy required to attain this flow on a sustained basis.
Where Fruin is correct in his observation there are phenomena of high density crowds which fall outside his reported observations. We illustrated, in chapter 2.4, the phenomenon of self-organization in bidirectional, high density environment. The fingering effect is spontaneous and high density crowd behaviour has other unique characteristics which we will discuss in chapter 6 - Validation.
3.1.5 Green Guide - density v speed
The Green Guide states that the capacity of an exit system is limited by its narrowest element . . .Where reservoir areas are used as part of an exit system, their capacity should be calculated on the basis of the appropriate rate of passage (109 people per metre width per minute). A density of 40 persons per 10 square metres of the area available for standing within the reservoir area is the maximum permitted for safety. It is the responsibility of management to ensure that this density is not exceeded.
2013 update - the fifth edition of the Green Guide revised the flow rates down to 82 people per metre per minute on level surfaces and 66 people per metre per minute on stairs. At the time of my PhD Research the data in the literature had significant inaccuracies - specifically the differences between the various UK/USA and International guidelines. This is still an international problem as the figures of 109 people per metre per minute are used, to this day, to justify crowd movements in normal and emergency conditions.
3.1.6 Fruin v the Green Guide
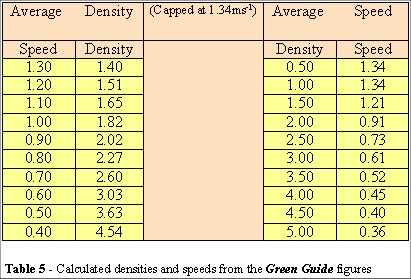
The Green Guide states that a maximum flow, for safety, is 109 people per metre width per minute. This figure is used throughout the Guides [1, 2, 5] worked examples as the base figure for calculation of both the egress capacity and flow rates. If the speed of the individual is been capped at a nominal 1.34 metres per second we can use it as a comparison to the Fruin data.
109 people per minute per unit (metre) width equates to 1.82 people per second per unit (metre) width.
Using Flow Volume = Average Speed x Average Density [1, 2, 5] we can derive two tables: density and speed.
Togawa, Ando, Aoki and Oto [7, 8, 9, 10] studied the speed density relationship with respect to their development of a simulation system (based on grid matrix analysis) and derived the curve (Figure 84). This is comparable with the Green Guide calculations. Togawa [3, 26, 27, 28] derived a formula for the speed density relationship (Figure 33):
-0.8 ρ oWalking velocity (V) = V
Where ρ is the density in persons per square metre, Vo is a constant 1.34 ms-1.
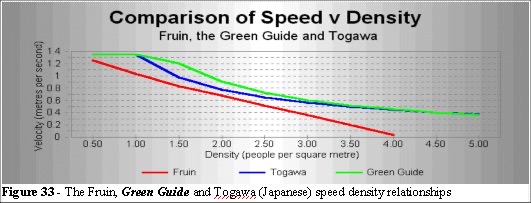
We compare this to the Fruin LoS and observe that the LoS criteria may be inappropriate at higher densities. We can also see that if we maintain the LoS concept then the safety margin is generous with respect to the Guides’ recommended speed versus density relationship. The Green Guide states.
When applying the guidance and recommendations in the Guide, it should be remembered that the principal objective is to “secure reasonable safety at the sports ground when it is in use for the specified activity” (as stated in section 2(1) of the Safety of Sports Grounds Act 1975). Absolute safety, however desirable in theory, is, in reality, unattainable.
To establish safety criteria, without a clear understanding of the levels of risk, we are not able to secure reasonable safety by definition. We need to define the speed versus density relationship more precisely than the LoS indicators.
2013 Update - the above graphs only serve to show the point made in the previous update. That the relationships between crowd flow and crowd density and crowd speeds was poorly understood and poorly applied to the complex and built environment at that time.
3.1.7 Is high density unsafe?
We consider normal ingress packing density at Wembley Stadium as typical of a safe ingress. Gate C (Wembley) has 10 turnstiles and these have been measured at 660 people per hour per turnstile - in fact, they were the standards that set the Green Guide measure. The packing density in that area exceeds the limit of 4.0 people per square metre (Figure 34).
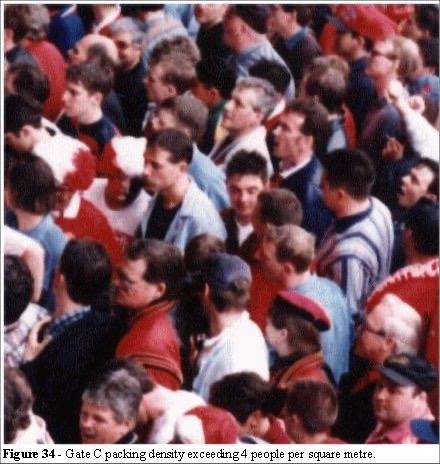
At this packing density (gate C) Wembley allows 660 people per hour per turnstile (10 turnstiles) therefore 6,600 people per hour flow through these densities in safety. It is clear that we have to define a safety limit of high density exposure with respect to time.
2013 update - the graph shown in this link highlights the risk and density relationship. I differentiate between moving crowd risk and density and static crowd risk and density.
3.1.8 How long can high density be sustained?
The limiting factor is the chest cavity where breathing is restricted. Clearly we cannot test the limits in a crowd as that would endanger lives, however we have several examples with which we can define a working criterion for high density exposure in a moving environment.
From the Green Guide we have the limit of 4 people per square metre set as a safe density for a moving crowd. This density may be exceeded during ingress and egress situations for limited periods. However, it is an average value and we need to consider the range of densities for risk assessment. We shall take gate C at Wembley Stadium as a measurement to assess a density and time limit for a safety criterion.
The area at gate C can support 500 people (from chapter 2.3.1). We can see from Figure 34 that the density in this area has exceeded the Green Guide limit of 4 people per square metre. There are 10 turnstiles and each can process 660 people per hour. Given the uneven distribution of usage we shall take a figure of 600 per hour as a basis for calculation. This allows 5,000 people per hour, or 10 times the volume of traffic present in turnstile area. The exposure time is then calculated as the time it would take an individual to navigate high density areas.
It is reasonable to set the time exposure to high density as follows: 5,000 people per hour = 83.333 per minute. 500 / 83.333 = 6 minutes. The time taken to process 500 people is therefore 6 minutes. We shall use this value as our limit for exposure to high density. If an entity is exposed to density above 4 people per square metre for more than 6 minutes then we need a safety alert in the simulation system.
2013 update - at the time of this research there was no method of measuring pressure and exposure to risk. Over the last few years we have developed a much better understanding of the shockwaves, how the develop in crowds, and the significant risk they pose to crowd safety - click here for more information on this important point.
3.1.9 Is the Fruin Level of Service wrong?
It is important to note that we are not stating that the Fruin LoS is incorrect. Clearly there is a margin for increased density and flow in a safe and non threatening environment. The LoS standards, as a design criteria, is clearly an ideal guideline to achieve. But flow does not cease at the Fruin LoS-F, therefore we need appropriate measures for risk assessment at high density.
In constrained geometry (where walls or fences are boundary limits), a high density flow constitutes a hazard. The photographs (Figures 9, 10 and 22) were taken prior to the gates opening at Wembley Stadium for a FA championship cup final. Here the crowd (multidirectional flow) is moving in a shuffling manner. The density is approx. 4-6 people per square metre, higher than the Fruin observations. Although the area attracts criticism for being overcrowded, no incident has been recorded where pedestrians have been injured due to congestion.
Within the stadium, in enclosed spaces such as concourses, the circulation of supporters often exceeds the density observed by Fruin. These areas are also observed to be free flowing in multiple directions.
The effects of geometry (dead-ends, barriers, constriction in corridors and changes in corridor widths) create their own dynamic compressions in a moving crowd. We need to know the limits for safety and how close any particular environment is to those limits.
To conclude, the Fruin Level of Service is not wrong! When it is applied as a general rule of the thumb there can be little doubt that there is margin for error. Fruin also states his concerns clearly.
Many designers have been using the maximum flow volume, which occurs at or near the critical pedestrian area occupancy, as a basis for design.
We will see that calculations based on maximum flow rates are dangerously close to the safety limits. We now examine other aspects of stadia ingress and egress design.
3.2 Effects of geometry
When approaching a set of turnstiles or entry gates, the spectators do not distribute evenly across the whole area. With respect to the Green Guide, which quotes 660 people per turnstile per hour, might say that all geometries are equal, but some are more equal than others when flow rates are averaged over time.
The reasons are obvious but the effects on system, and the network performance can be quite pronounced. We shall examine the geometry and approaches at Wembley Stadium with respect to the turnstile gate ingress trip counter totals.
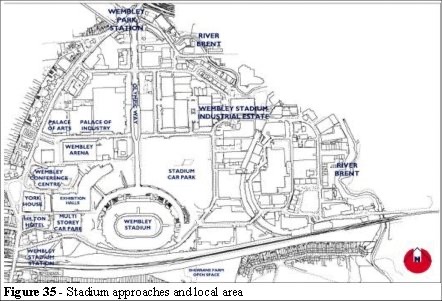
The main approach route to the stadium is via the underground station (Wembley Park Station) which leads to Olympic Way and joins the main concourse in front of the banqueting hall. There are car parks (Figure 35) surrounding the concourse areas. The Chiltern line station is seen on the lower left (Figure 35).
3.2.1 Approach routes to Wembley Stadium
Every stadium ticket has a plan printed on the rear. The ticket indicates the turnstile gate, block, row and seat number. The exceptions to this are concert tickets where only the turnstiles are indicted. The ticket also details transport details including rail (Wembley Complex Station), underground (Wembley Park Station), bus and car. Spectators are well informed of their entry gate and seat locations.
3.2.2 Problems with entry points
It is clear that inappropriate signage inside the stadium can be a problem, where congestion can human traffic can be high. However, the same principles applies to the approach routes. Although emphasis is made in the Green Guide - 6.9 Providing clear information, which relates to numbering of the turnstiles and gates, there is no account of the problems associated with inappropriately placed signage, or visibility of signs in crowded areas, for normal and emergency egress.
The Green Guide states:
6.7 Providing a sufficient number of turnstiles or entry points.
Although the entry capacity is determines by the number of spectators who can be admitted within a period of one hour, in practice many grounds admit spectators well in advance of the start of a sporting event. Furthermore, for many events, large numbers of spectators arrive close to the starting time. These variations should be recognised when determining the number of turnstiles or entry points to be provided, or staffed on particular event days.
The Green Guide goes on to state that:
6.8 Design and management of entrances and entry points
The design and management of entrances and entry routes should take into consideration the following:
a) Entrances to each part of the ground should, wherever practicable, be designed and located so as to allow for the even distribution of spectators and to prevent local pressure building up outside the ground.
What is missing from this design criterion is an explanation of the problems associated with turnstile designs. Looking at the plans of Wembley one could conclude that they look as if they would have an even distribution, at least on one side. However, the approaches do not support even turnstile distribution. This needs to be addressed both in a qualitative and quantitative process during the design phase as ingress routes, circulation routes and egress routes can all have hidden problems.
We can apply some simple geometric rules to analyse the likely problems that might be expected along these routes. But, before we do this, it is important to clearly identify the problems associated with crowd dynamics and how they relate to entry routes. We shall assume that people will use the least effort to move from their present position to their next position.
As we have seen, from Figures 9, 10 and 22 the concourse is congested in areas where bidirectional flow occurs. We can also see from Figure 11 and 21 that there are a number of concessions stands on the concourse (indicated by the square and triangular blocks in Figure 21). Concession stands create local high density as people queue for food, beverages and merchandise. The crowd dynamics are complex.
3.2.3 The Wembley Turnstiles (A-M)
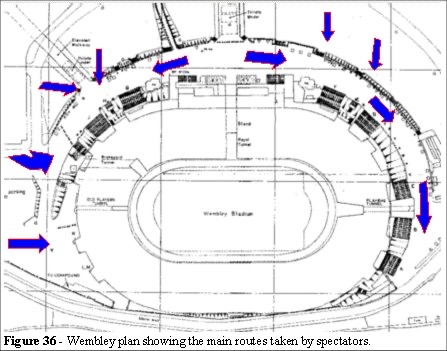
During 1994-1995 records of the turnstile counts (chapter 2.7) were obtained. These highlight the problems that geometry and crowd dynamics have on turnstile usage. When we examine the layout of Wembley Stadium (Figures 35 and 36) we can see that the turnstiles are evenly distributed only on the Northern side of the concourse. The Southern side is bounded by a road so the inner concourse (level B) is used as a circulation route.
Supporters who have tickets for the South of the stadium gain entry via turnstiles A, L or M. To understand the problems we examined each of the Wembley turnstile gates in turn to determine the principles of least effort and the effects of geometry. We illustrate this with a few examples in the following section. 3.2.3 The Wembley turnstiles (A-M). From the turnstile distribution the queuing behaviour (Figure 37) is typical, and during the two years of observation this phenomenon was noted at the turnstiles.
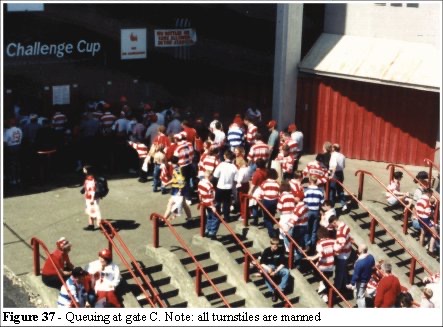
The combinations of a strong visual indicator, local geometry and queuing behaviour are all contributory factors. Once a queue has formed it has a dynamic attraction of its own. We can see how this behaviour can arise. Given a choice of a queue that is moving or an apparently empty turnstile, at the top of a set of stairs, which might be unmanned, you can save yourself a trip up the stairs and simply join the queue. You know that the queue is going somewhere, but you do not know what awaits you on the empty stairs. Therefore it is less effort to join a queue.
The turnstiles around Wembley Stadium, have a large red letters printed on a white sign. At turnstile D there is a moderate central bias - this is a function of the angle of approach and the location of the turnstile indicators. The turnstile bank is not central to the stairs, and we see a significantly lower proportional use of turnstile 10.
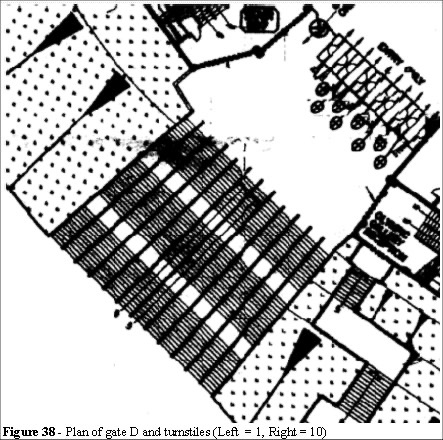
People prefer a route with a minimum number of angular turns, which gives rise to the uneven distribution, this requires the least effort to reach a destination.
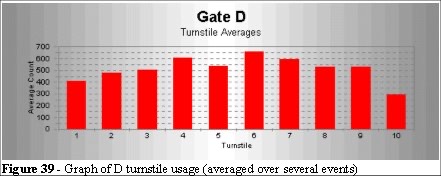
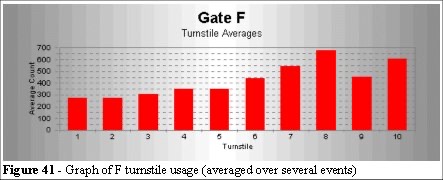
If we compare the distribution of turnstile D to turnstile F we can see how the differences in the geometry can effect the distribution (usage) of the turnstiles.
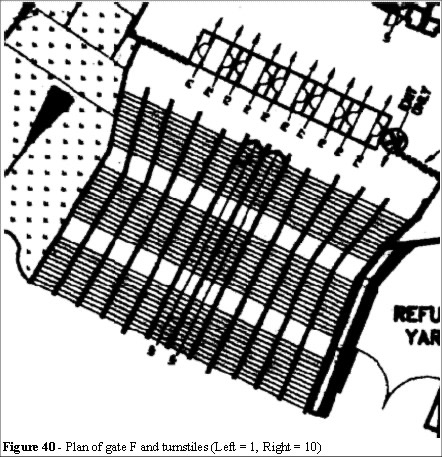
Gate F (Figure 40) has a stair configuration that spreads out and presents an unusual visual reference to the spectators on their approach. The propensity for the crowd to flow in paths of least effort leads to the imbalance we see in Figure 41.
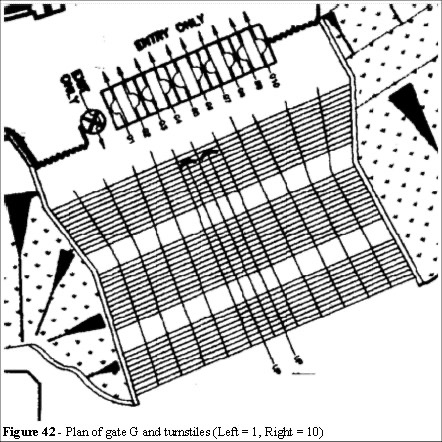
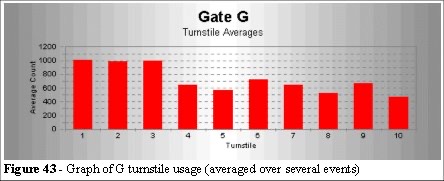
Gate G is approached from the left (Figure 42) we can see the principles of least effort can allow us to predict the turnstile usage. The graph (Figure 43) is predictable from the relative interactions of the people with the geometry.
We can see the effect that the shortest route has on turnstile usage. Furthermore we can see that the dynamics of a crowd turning a corner also has an effect on usage and distribution. One could speculate why the figure of 660 people per turnstile per hour is multiplied by the number of turnstiles to provide the ingress capacity figures! Averages can conceal hidden surges and peaks in the data.
Estimating ingress capacity based on numbers of turnstiles may not be the most appropriate method of calculating ingress capacity. However, crowd dynamics and shortest path combine to produce different analysis of the effects of geometry, a least effort view of turnstile usage.
Post mortem analysis of the Hillsborough turnstile configuration (Figure 27) reveals there were inherent design problems for a large crowd approaching from Leppings Lane. This highlights the need for a different approach to the design of places of public assembly and a more appropriate methodology for risk analysis.
3.3 Network analysis (Green Guide)
A stadium, indeed any place of public assembly, can be a complex system consisting of multiple routes through the geometry and multiple ingress/egress options. To facilitate understanding on these geometries the Green Guide stipulates that once spectators have passed into the exit system they should be able to keep moving throughout its length. In the event of an incident which renders the usual exit route unusable, spectators should be able to use an alternative exit route or routes. Where there is a simple exit route; that is, a direct passage from the viewing area to the exit gate from the ground, every part of that route should be able to accommodate the flow from the terrace or stand area. For a more complex exit system which combines a number of exit routes and/or offers a choice of alternative routes, the system should be analysed in the form of a network. This is in order to check that the capacity of the exit route from the viewing area is sufficient to ensure a free flow of spectators to the various exits from the ground. Where branching of routes gives spectators a choice of paths, the proportion of the crowd likely to use each part should be assessed; for example, the exit closest to a railway or bus station may be likely to attract a higher proportion of spectators. Grounds which have complex exit systems should have clear, illustrative plans of the network system which serves each section, identifying the capacity of the routes within the system. These plans should be kept with the drawings of the section of the ground to which they relate. Any changes to the ground which affect the entry/exit routes should be identified on the network plan.
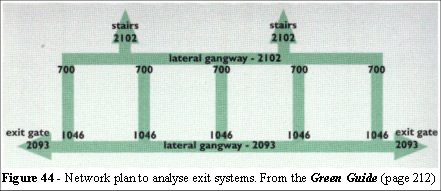
A series of worked examples are included to assess both the capacity and the flow calculations for networks. The example (Figure 44) shows an assessment.
The Green Guide states that:
The purpose of the plan is to analyse each part of the exit system to ensure that it has the capacity for all spectators to flow freely through it within eight minutes.
In principle this is a very good idea, assessing the individual routes and taking the aggregate flow as each path converges. The figures relate to the proposed eight minute evacuation time. For example, the exit gates are 2.4 m x 109 ppm x 8 minutes = 2,093. However, this is a naive assumption and the dynamics of crowds are not so easily calculated. The Green Guide is assuming that the maximum flow is sustainable and homogeneous. As Fruin indicates this assumption is dangerous.
Furthermore, the effects of local geometry are not considered in a network analysis, the relationship between speed and density is not addressed and neither are the interactions of merged flows.
It is important to note that network systems are not behavioural. They demonstrate evacuation capacities based on the assumption that people behave in an appropriate manner.
3.3.1 The dynamics of crowds in a network
Crowds do not flow like fluids. They do not fill space in an even and regular manner. We call this effect the space utilization function. This effect is often neglected and the following examples illustrate the problem in a simple geometry (Figure 45). Figures 45 and 46 show that the density at the corner is higher than the surrounding area, the inner corner is used more often. The measure of space utilization is a central theme in the simulation of crowd dynamics yet, according to the Building Research Establishment [29]:
"...corners and bends have no effect on flow rate !"
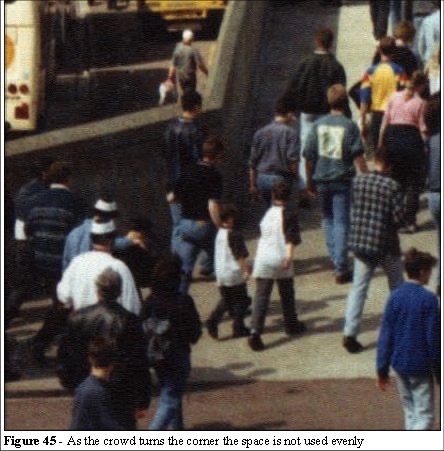
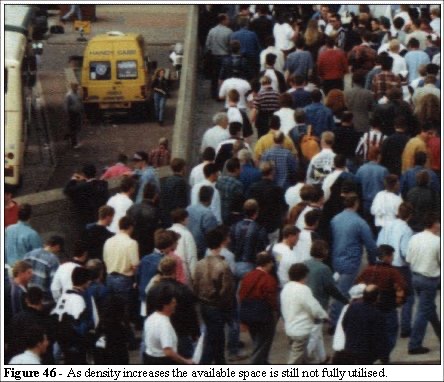
The corner effect is neither a transient, nor negligible. It relates to the dynamics of crowds and the use of space, it has a relationship to the crowd density and speed. It can be seen (Figures 45 and 46) that there is an effect on flow rate as the crowd compresses into a smaller area it slows down.
In confined spaces crowd dynamics is a function of the local geometry and this effect can dominate the crowd flow and behaviour especially during emergency egress. Study of crowds under emergency conditions is clearly too dangerous to investigate. However, with a suitable simulation we could study a variety of scenarios, potential problems, their consequences, and the outcome and effect of changing the local geometry.
3.3.2 Braess’s paradox
Braess’s paradox [48] is an important consideration for the analysis of any network system that has alternative routes. To summarise Braess’s paradox: you sometimes increase congestion by increasing a choice of route. This is a similar finding to the interaction based paradox, where an increase in the number of interactions can reduce the overall system flow performance. Typically you find examples of the paradox in city traffic design and network analysis.
Mark Wainwright has turned a description of Braess’s paradox into an excellent html. The following description is very heavily paraphrased from his website [49].
To illustrate this paradox consider a network of roads between two sites (A and B in Figure 47). These types of networks are typically described in economic terms, associating a cost for travelling on a particular edge of the network. Each edge in this example is labelled with some function of the number of cars on that edge: the more cars the longer the journey time, the more frequent the number of accidents, the longer delays become, hence the greater the fuel consumption will be. The function of cost will in general be complex but for the purposes of illustration we shall assume a simple linear function for each road (Figure 47).
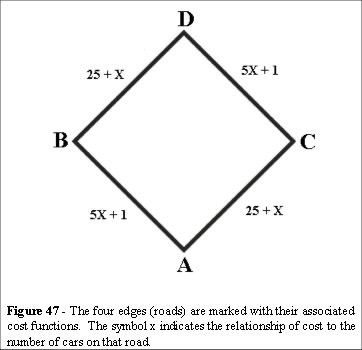
Consider each car in turn leaving from A. Every driver can observe the density of traffic ahead of him/her and make a choice of route based on that observation. The first driver is presented with two empty roads, and we shall assume that his probability of going either way is 50%. Successive cars using this network will be influenced by the previous driver’s choice assuming free flowing conditions. We shall also assume a small number of cars (say 6) therefore the cost for each car will be 26 + 6x3 = 44.
Braess’s paradox is observed when another road is added (Figure 48).
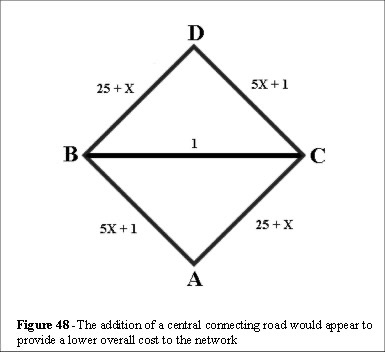
We can see that the driver of the first car now has several alternative routes through the network: A-B-D (6x + 26), A-B-C-D (10x + 3), A-C-B-D (2x + 51) and A-C-D (6x + 26). He would take A-B-C-D as it has a cost of 13 (10x + 1: x=1). Driver 2 may take A-B-C-D as it is still the lowest cost (10x + 3 = 23: x = 2). Driver 3 may also take A-B-C-D (10x + 3 = 33: x = 3). Driver 4 may take A-B-D but this would cost 42 (5x + 1 = 16: x = 3, 25 + x = 26: x=1) so he takes A-B-C-D, whose cost is only 22 (5x + 1 = 16: x = 4 + 1).
By the time Driver 5 sets out, A-B-D cost 27 is cheapest (5x + 1 + 1 = 27: x = 5). Driver 6 takes A-Y-B with the same cost (52). We can see that as the road usage increases the addition of the X - Y road has increased the overall cost of transport.
We have added an alternative route and the cost to the whole network has increased. This is counterintuitive, and the impact is not easy to perceive, or to calculate unless you are familiar with the nature of these types of problem.
We have to examine the paradox in more detail. First let us consider the assumptions we have made in this model.
- Cars enter the system in single file.
We have allowed each driver to enter in turn and make a decision based on their perceived congestion in the network.
- The Greedy algorithm is implicit.
We have allowed each driver to take the route with the lowest cost/least density.
These assumptions may be incorrect, so let us first examine the network in more detail. In our original network, the solution we found (three drivers going each way) is stable. This means that once the cars are arranged this way there is no advantage in changing route. Any route changes will cost more (traveling back down the network).
It is also the only stable solution. If we arrange the cars in a different way, say four to the left and two to the right, then one driver will soon notice that he can lower his own journey cost by taking a different route.
So, if we start with any arrangement of cars on roads, but let the cars change to a different route if it is cheaper, they will soon arrive at the stable solution. This is also the one we find by the greedy algorithm.
What is particularly interesting is that these properties apply to the modified network. The solution given by the greedy algorithm, with four cars taking A-X-Y-B, and one each A-X-B and A-Y-B, is stable, and it is the only stable solution. If the six cars start off by using their old route to work - three each to the left and the right - one driver will soon notice that he can improve his time by cutting across between X and Y, and gradually others will also change until the cars are arranged in the new formation where everyone's journey is more expensive.
We have a solution where every car is careful to take the cheapest available route, and yet the total cost has increased. How can adding a road to a network slow everyone down?
The key is how the cost of using a road varies with the number of cars. Using our linear functions, we can imagine the constant term as representing the road's length, and the term in x an indication of how prone the road is to congestion. Note that this idea supposes that the `cost' of a journey is purely a matter of how long it takes. Then the new road allowed a shortcut between the two northwesterly roads, which are shorter than the alternatives, but suffer from substantially worse congestion.
The result is that each driver in turn takes this slightly quicker route, at a small saving for himself, but causing substantial extra delay to a number of other drivers. By the time everyone has decided whether to take the short cut, the total congestion gained by the system far outweighs the savings in distance.
The modified network is really a classic example of the Prisoner's Dilemma (PD), a paradox with many applications. Adding the extra road gave the commuters the opportunity to `defect', in PD terms. In this particular case it did not even have any compensating benefits.
When we consider the paradox with respect to egress systems we have many examples of Braess’s paradox in building design. Specifically, the assumption that adding addition exit routes it will increase the overall egress capacity. This also applies to the addition of ingress routes to a stadium. Simply adding more may not solve the problem of how to increase the ingress capacity. We return to this issue in chapter 4.1.2.
3.3.3 Braess’s paradox and the Green Guide
We can see that even a simple calculation based on a network can have unexpected results. This is relevant to the network example in the Green Guide for two main reasons. Network analysis is oversimplified, and the impact of the local geometry on crowd behaviour has not been sufficiently highlighted.
The time taken to exit a system in an emergency is a critical factor for crowd safety. For safety analysis, every factor has to be considered. This includes the paradox posed by Braess. The oversimplification of network analysis in the Green Guide can have hidden and potentially catastrophic consequences. When a network system offers alternatives for egress, the impact of losing some of these in an emergency has to be part of the safety calculations. The Green Guide alludes to this but does not consider the impact that Braess’s paradox can have on an emergency egress system design.
The impact of local geometry also includes the visibility of signage in crowded situations, the dynamics of crowd flows as they merge and the relationship between speed and density in confined spaces.
As previously stated the Green Guide has been revised considerably in light of recent disasters; however, as regards this particular issue there are problems that need to be addressed. When a system is complex it should not be reduced to the simplistic analysis presented in the Green Guide.
3.4 Review of other simulation systems
Crowd simulations fall into two main categories; behavioural and movement models. The behavioural models are essentially two types; conceptual models which include the observed, empirical and reported actions of individuals from questionnaire studies (e.g. Canter [40, 41, 42, 43]. Sime [44, 45, 46, 47] et. al.) and computer models for the simulation and behaviour of individuals with respect to information seeking and processing. Behavioural models do not include the dynamics of crowds in their analysis.
Of the movement models there are two main types; these are the fluid or particle systems and the matrix-based systems.
In the fluid category the applications of the Boltzmann Gas equations are used (Exodus, Rampage and Dirk Helbing’s work). In the matrix systems (Egress, PFES and Pedroute) the use of the Fruin data is implicit.
The Author developed the VEgAS (Virtual Egress Analysis and Simulation system) a prototype to the Legion system. The VEgAS system was unable to model the complex dynamics of large crowds and the system. Legion, was developed on the principles discovered during the development of VEgAS. The virtual reality system was used to prove the basic relationships of crowd dynamics.
To understand the need for an emergent system we need to examine the problems associated with modelling networks and their failure when applied to crowds.
3.4.1 Passenger Flow Evaluation System (PFES)
Toshiyuki Aoki and Hiromichi Oto are developing a system in conjunction with the Japanese Research Institute [7, 8, 9, 10]. This system is based on the principle that predefined crowd movements can be ascertained and a simulation based on these factors. Grids are laid on the floor plan (maximum number 150 x 60) and each grid indicates a general direction, flow rate and predetermined speed/density relationship. It is effective but, as with all systems in this category, dependant on operator skills in creating the correct grid parameters.
The system is basically an application of the Fruin models with suitable adjustments for the Japanese profiles and speeds measured on their transit system (1.4 metres per second for free flow and an associated graph to determine the speed in various cross flows).
Aoki et. al. are working on a micro-model which calculates individual parameters. Their input data is the Togawa data not the Fruin data (we shall compare the data in chapter 4).
3.4.2 Egress (SRD AEA Technology)
Like the Aoki system the system from SRD [50] is based on grids (in this case the grids are hexagonal). They use artificial intelligence techniques to determine how an agent will react in a variety of circumstances including fire. They have based their artificial intelligence rules on the research of Canter, Sime, and Fruin. Canter and Sime are crowd psychologists and have defined a number of important factors in crowd psychology. We examine these in chapter 4.4.
In their paper [50] SRD highlights the various speed/density curves associated with Fruin, Pauls [21, 22] and Predtechenskii and Milinskii [50] with the warning that there is significant spread in the data available.
They rely on the relationship:
f(p) = p * v(p) (Flow rate = Density * Speed)
Where f(p) is the flow rate and v(p) is the speed at crowd density p.
Their approach is fundamentally a cellular automaton process in which the transition of people from cell to cell is based on an occupancy of the cells. They calibrate their data against speeds where experimental data exists. SRD demonstrate that the historical data is flawed in that it relies on homogeneous flow assumptions.
3.4.3 Pedroute
Pedroute is a computer simulation system which was originally developed by Gerry Weston at London Underground Limited. The intellectual property rights were then sold to Halcrow Fox. Pedroute has been used extensively used to model crowd parameters in underground networks around the world. It is the extension of Fruin’s Level of Service and relies on that data being an accurate representation of the crowd dynamics with respect to local geometry.
During a stadia safety conference [52] Paul Clifford of Halcrow indicated that the speeds they measured were double that of the Fruin indicators [53]. The system performance therefore has to be questioned as the reliance on the Fruin data has been shown to be incorrect during their own research.
Pedroute also suffers inaccuracies when cross flows, concourses and other local effects do not have Fruin data. In those cases the closest approximations are made. The deficiencies of the Fruin data are highlighted, in particular the problem associated with applying the Fruin data for multidirectional concourse areas.
There appear to be further limitation to the Pedroute system. When creating a model, several adjustments have to be made, both to the sizes of the grids and their Level of Service usage. As with any system the output of their model is a function of the skill of the operator. The main problem is that these types of system do not tell us anything new; they are based on assumptions which, as we have seen, are questionable with respect to field observations.
Assuming an a priori speed/density relationship, as we have seen, is inappropriate to the understanding of crowd dynamics. What is required is a minimum of input parameters and a minimum of a priori assumptions. What is required is a system that can be used to analyse the subtleties of crowd dynamics. We need an aide to our understanding and a system that can increase our working knowledge of the parameters that affect crowd safety.
This is not to say that the aforementioned systems should be discarded. Indeed the limits that Fruin has set provide ample safety margins, if rigorously applied to the building design guidelines. In the hands of a competent engineer these systems provide useful information when deciding the building criteria for safety.
However, it is those cases where we do not have appropriate data, or where there is not enough space to maintain consistent low density flow rates, that we need to acknowledge.
3.4.4 Exodus
Ed Galea [23, 24], University of Greenwich, has adopted fluid dynamical models and coupled these with discrete virtual reality simulations of human movements. His product, Exodus, has been used in a number of major projects, worldwide. In his description of the Exodus system he states:
Exodus was designed to simulate the evacuation of large numbers of individuals from large multi-floor buildings. The model tracks the trajectory of each individual as they make their way out of the building or are overcome by fire hazards such as heat and toxic gases. The model is a collection of 20 attributes that fall into four categories: Physical (age, weight, gender, agility), Psychological (patience, drive) positional (distance travelled) and hazard effects (FIN, FICO2, FIH).
On the basis of each individual attribute the model activates each and every simulated human and proceeds to assess the impact on the egress statistics. These attributes add to the computational intractability of testing, for example, what is the egress rate for the overweight?
In 1986 J. P. Stapelfeldt placed 100 police cadets in a compartment containing a single exit. Paulsen [25] reported on that experiment in 1995. Different exit widths were considered 0.75, 0.80, 1.5 and 1.6 metres. Population densities at the exit were measured at 4 persons per square metre. Within Exodus a 3.0 by 8.5 metre enclosure populated with 100 males was specified. This achieved the desired density and evacuation results which were in line with the Paulsen report, namely 30 seconds to clear the area. It is noted that the flow rates here were measured at 1.96 and 2.30 occupants per metre per second. These figures are in line with the Green Guide specification as discussed earlier.
3.4.5 Rampage - Animation Science
Eyal Cohen [26] developed sophisticated particle simulation systems to animate explosions and other elementary primitives. He has modelled the human behaviour into reflex (immediate) reactions and inference (decision) reactions based on knowledge obtained from the scene. The principles behind his modelling are based on the Boltzmann gas equations which we shall discuss in chapter 3.5.6.
His company, Animation Science, has applied the model to a number of well-known situations with iterative adjustment of behaviour until empirical results are reproduced. The main source of their calibration has been Fruin [6] and P&M [51]. Calibrations to these standards have already been proved, in previous sections, to be questionable.
In discussions with Cohen [27] and Fruin [54] the author has expressed concern that certain historical data are not applicable, both were in agreement. However, although the application of high resolution graphical software is no substitute for scientific validation, it does convince the clients, it does sell. This sentiment is echoed by Galea in his discussion of the current simulation systems available in the market.
In defence of the simulations systems that are available the historical data is sparse. It is not feasible to test a large scale crowd to destruction in order to gather new data. We have seen that the use of the Fruin data may leave sufficient margin for error and, provided the limits are understood, then these systems can be used in the design and operation of places of public assembly. The Rampage product uses historical data and not the designers’ own field studies.
3.4.6 The social force models
Dirk Helbing [13, 14, 15, 16, 17, 18, 19, 20] has completed several years of research in the application of the Boltzmann-like gas-kinetic approaches. Helbing [18] describes a variety of human behaviours which are outlined below.
- Pedestrians normally choose the shortest route to their next destination which has therefore the shape of a polygon. If alternative routes have the same length, a pedestrian prefers the one where he/she can go straight ahead as long as possible provided that the alternative route is not more attractive (due to less noise, more light, friendlier environment, less waiting time at traffic lights etc). A pedestrian feels a strong aversion to taking detours or moving opposite to the desired walking direction, even if the direct way is crowded. This conclusion is echoed by Alan Penn (University College of London - Bartlett School of Architecture) [28] in his work on space syntax. It is also the observed behaviour at Wembley turnstiles during an ingress, by the author.
- Pedestrians prefer to walk with an individual speed, which corresponds to the most comfortable walking speed as long as it is not necessary to move faster in order to reach the destination in time. The desired speeds within a crowd are a Gaussian distribution with a mean value 1.34 metres per second and a standard deviation of 0.26 metres per second [11, 12, 55].
- Pedestrians keep a certain distance to other pedestrians and borders (of streets, walls and obstacles). This distance is smaller the more a pedestrian hurries, and it decreases with growing pedestrian density. Resting individuals (waiting on a railway platform for a train, sitting in a dining hall, or lying on a beach) are uniformly distributed over the available area if there are no acquaintances among the individuals. Pedestrian’s density increases (i.e. interpersonal distances lessen) around particularly attractive places. It decreases with growing a velocity variance (e.g. on a dance floor). Individuals knowing each other may form groups which are entities that behave similarly to single pedestrians. Group sizes are Poisson distributed.
- Pedestrians normally do not reflect their behavioural strategy in every situation anew but act more or less automatically (as an experienced car driver does). This becomes obvious when pedestrians cause delays or obstructions, e.g. by already entering an elevator or underground even through others still try to get off.
Additionally, Helbing found that at medium and high pedestrian densities the motion of pedestrian crowds shows some striking analogies with the motion of gases and fluids. These include viscous fingering, propagation of shock waves in dense pedestrian crowds and pedestrian-free bubbles. Apart from these phenomena, there are some analogies with granular flow. The velocity profile is flat, the Hagan-Poiseulle law does not hold [56].
Spontaneous organisation forms in lanes of uniform walking direction once critical density is exceeded (LoS-D). Also at bottlenecks (e.g. corridors, staircases or doors) the passing direction of pedestrians will oscillate with a frequency that increases with the width and shortness of the bottleneck. This is analogous with the fluid-dynamic “saline oscillator” and with the granular “ticking hour glass”.
The observations at Wembley are in line with Helbing’s research. However the work of Helbing relies on assigning complex calculus and a thorough understanding of the Boltzmann-like gas-kinetic equations. These equations are difficult for the expert to understand, let alone for those responsible for crowd safety. The Rampage system has developed along similar lines but relies on validation against Fruin et. al.
Both Helbing and Cohen have tackled the problem using a top down approach. Given that calculus is a mathematical approach to solving some problems (such as catching a ball in flight) one has to speculate that there may be a simpler mechanism that could be applied to the problem. After all not everyone is capable of manipulating the calculus, but we are all quite good at catching things. Although the macro models have some success in their application to crowd dynamics, they have too many a priori assumptions, unmeasurable factors and therefore they may be of limited use. There had to be a simpler way of predicting the dynamics of crowds.
It was this assumption that “perhaps there is an easier way to do this” that led to the development of VEgAS and then Legion.
2013 Update - over the last 5 years this has proven to be true. The principles and applications of crowd science, specifically those that lead towards a greater understanding of crowd safety, are the main themes in my workshop/teaching materials. Click here for more information.
3.5 VEgAS
We began chapter 2 with statements regarding computer simulations. If we could somehow perceive the design in an emergency, visualise the problems and practice various egress strategies, we would be able to perform quantitative and qualitative risk assessment.
How can we be sure that the egress design is operationally effective and safe? One possible solution to these problems is the application of virtual reality. This allows the engineer to enter a computer simulation of his design, experience an event, use this insight to improve the design, and then test various contingency arrangements. The author originally developed VEgAS (Virtual Egress Analysis and Simulation system) as a low cost virtual reality environment specifically designed for egress analysis.
The VEgAS system originally used a series of conditional “IF ..... THEN .... ELSE” logic statements to model the human interactions. For example, IF “entity” Behind “Little old lady” THEN “overtake” IF “speed(Little old lady”) LESS THAN speed(entity). It soon became obvious that this approach was intractable in that one cannot determine a priori all the possible conditions that could occur. The paradox being that if one could determine all the possible outcomes then there would be no real use for such a system.
In the original design some eighteen pages of conditional statements were included, along with various inputs from Sime, Canter et. al. A period of eliminating the conditions one by one followed until the system no longer supported the behaviour observed from the field studies. Examining this code led to two revelations, firstly that there were many conditions that could not be assigned a priori, for example: today I may feel like overtaking, tomorrow I may not (I am more tired). Same person, different reactions on different days. Most of the conditions could be replaced by noise. The second and most startling discovery was that the system self-organised. It did so in the same way that the bidirectional flow self organised in field observations when the algorithms were allowed to communicate, entity to entity. We discuss this in chapter 6, validation.
3.5.1 The uses of virtual reality in egress analysis
Building information systems, which are designed to help, may at times be ineffective. The position of emergency exit signs may be obscured by smoke, or worse may suggest circuitous exit routes. The design concepts can be diluted from the architectural plans through to the final contractor selecting and fitting signs. This presents two problems. Firstly, how can we test way finding and egress routes in the building, secondly, how can we ensure that the recommendations are communicated efficiently?
To address the first problem we can create a virtual model of the building, position the exit signs, simulate smoke, place a subject in front of the screen and let them try to find their way out. We can simulate fires in the computer generated building and observe our subject's reaction during virtual egress. This will provide information about the efficiency of building information systems and way finding. Using an iteration process from human reaction to computer simulation and back to human reaction, it is possible to assess probable reactions to the real design. By using this process of test and simulation we can run as many investigations as may be required. The objective is to determine if there are any problem areas, or unforseen reactions to the design during egress.
It is unethical to expose people to the dangerous environment of heat and smoke but a virtual person does not suffer from such constraints. We can program virtual people to react as a real person during the simulation. Using a combination of ergonomics and computer generated characters, reacting to a virtual event, it is possible to simulate problems and plan for contingencies with mixed ability populations.
The obvious advantage of modelling a character's responses to a virtual world, and then producing dozens of copies, is that it provides us with the means to test a crowd. We can then participate as a character in the crowd, analyse new reactions and generate new responses. The models developed form a comprehensive library for what-if analyses. To illustrate this feature, let us assume we want to test a train station for an egress scenario. We select a library of figures (anthropomorphically correct) and program them to respond to a change in environment then, say, simulate a fire. With the appropriate responses to stimuli (heat, smoke other peoples influence) we can monitor and time them during egress. The result is a series of scale characters moving through a scale environment in real-time. What if there are a few elderly or mobility impaired people? Do they slow the egress? Are there any bottlenecks in the system? Can we increase the human flow rates safely? What if we increase the toxicity of the smoke or reduce the visibility? Does that have an effect on any potential threat of mortality? What does the signage look like when there is a crowd circulating in the area?
3.5.2 Intractable parameters
There is a problem with this approach. As we increase the number of parameters, we wish to test the complexity of the models’ increases exponentially. Testing just a few combinations quickly becomes intractable and we have no method of assessing their impact without an exhaustive series of tests.
When we consider the combinations of variables affecting an egress problem, number of exit routes, number of people, cross section of population, number of staff, type of staff; egress procedures, emergency services, nature of the threat, etc., we are looking at the problem from the top down. Can these combinations be reduced?
Consider a single character during the initial stages of an emergency. There are three choices of action: ignore, evacuate or investigate (Canter, Sime et. al. and Still [57, 58, 59, 60, 61]). These selections produce movement in a few predictable directions: towards the threat, towards safety (i.e. away from the threat) or no movement. The decisions involving whether to raise an alarm or tackle a blaze can produce a similar direction choice; towards or away from a location. This problem can be reduced to three variables that interact - Objective, Motility and Constraint - and one parameter which represents the reaction time; Assimilation.
To illustrate these interactions, consider the movement of people through a door. The Objective is to reach the other side. The Motility is the speed of each individual. The Constraint is the geometric size of each person, the position of the walls and the width of the gap. As the number of people increases the flow rate changes because of the Constraints on the system. Each individual will read and react to changes around themselves. These reactions are a function of the dynamics of the unfolding situation.
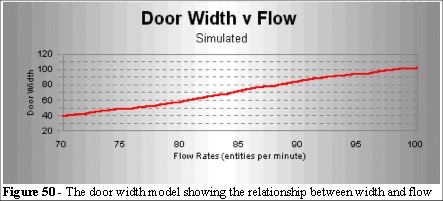
Applied to a virtual reality environment the result is a model that allows us to, for example, to visualize the flow through a door and then change the door width to test the effect on overall flow rates. Changing the geometry of the walls does not affect the Objective (to pass through the gap) but will have an effect on the Constraint and Motility. The interaction between these three variables may appear trivial but appear in many corners of science. When plotted against each other the results are fractal in nature [58, 59].
3.5.3 Flow through a door
To test the relationship between Objective, Motility, Constraint and Assimilation (OMCA) a model was created in virtual reality, Each entity could read and react to the aggregate behaviour, represented by speed and angle of attack, of the entities in close proximity. Several other types of behaviour were tested against a variety of geometries. These included reaction to nearest neighbours and random behaviour. This model was based on the dimension of a population of 95 percentile British males and represented the packing density observed during a normal egress from a football stadium. Each character is trying to move at between 1 to 1.5 metres per second and is constrained only by the density and geometry of the group.
One advantage of modelling in this way is that the interaction between Objective, Motility and Constraints can be seen when the geometry changes. As the density of the crowd changes the interaction between individuals changes. This has a consequence of changing the flow pattern which initially shows the sides moving faster than the centre, to an even flow distribution as the gap widens. Above a certain density-to-door width ratio there is no increase in flow as the crowd thins out and ceases to become interactive. The model displays the emergent behaviour observed in typical crowds. It does so when the entities are allows to exchange information about their angle towards the door gap.
The model shows the time taken for a number of characters to move through the door, the flow pattern, and the density. The applications for egress design are obvious. We can alter the width of the door, speed and sizes of the individuals.
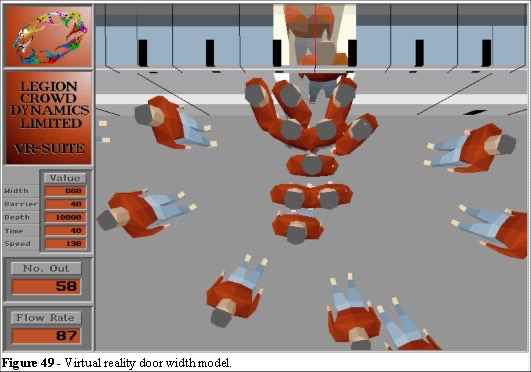
Figure 49 shows a typical door with a group of individuals trying to pass through a gap. As the interactions dictated the flow, it was speculated that the addition of a central barrier, or hand rail, would alter the flow rate through the door. In an article for the New Scientist [62] relating to the optimal position in a queue to facilitate the fastest route for boarding a train, the graphics (Figure 51 and 52) were used to illustrate the article.
The addition of the barrier in Figure 52 gives an improved flow (approx. 19% better in this example). By careful configuration the increase can be as much as 75%. However, the relationship is not linear.
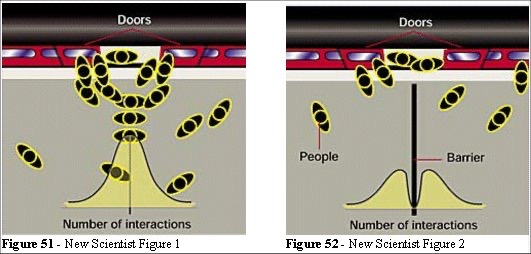
The graph shows the number of interactions with respect to their position. In Figure 52 a flow divider (handrail) has been included. This separates the group into two sections and the number of interactions reduces (Figures 51 and 52).
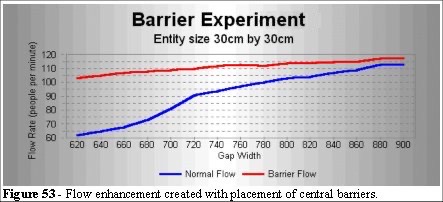
With the strategic addition of central barriers we have observed 25-75% increases in flow rates. These are virtual experiments but the considerable increase suggested a need for further investigation. There are optimum widths of doors and barrier geometries for different densities of populations. Comparisons with real-world geometries bear this experiment out.
These experiments suggest that for environments in which space and flow have to be carefully balanced (ship and aircraft design, theatres, stadia etc.), substantial flow rate improvements can be found using the VEgAS system.
Using virtual reality in this way enables the user to test very complex building layouts by programming characters for egress and testing the resultant emergent behaviour. This provides us with a powerful and easy to apply technique for flow modelling. Emergent flow techniques have applications for all aspects of human traffic analysis not just egress. The obvious question is; how does this property of emergence arise?
The answer lies in how the Objectives (to move to the end point), Constraints (to maintain minimum distance) and Motility (to maintain optimum velocity) interact. As people have a width greater than their depth, it may be expected that their sideways movement will be greater, due to streamlining. But, as our model can be set to use both square and rectangular sections to represent people, the same phenomenon occurs independently of the geometry of the individual shapes. The characteristic of sideways fastest flow emerges from the system due to these OMCA interactions. Furthermore when the model is changed from directed movement to noisy movement (by adding a random factor to the angle towards the objective) the resultant flow-rate is the same. This is a counterintuitive result, perhaps, but when we consider the number of interactions that are happening then the results are common sense. The greater the number of interactions, the more the entities have to stop and start, and the more the noise averages out of the system. Sadly, there are limitations to this type of modelling technique. The objective points had to be determined by hand and placed into the model. The number of objects is limited and (using Superscape) the developer could not be 100% certain how the software actually performed the calculation of movements. The collision detection was limited and also the scanning algorithms were limited to direct contact.
3.6 Conclusion to chapter 3
We have seen that the work of Fruin and the Green Guide have limitations. We have also seen that, in the case of new designs, these guidelines are not fully understood or applied. We could speculate that complacency, over-dependency on the Green Guide, and lack of appropriate tools may be factors in the crowd disasters of recent years.
2013 Update - sadly the above statement had proven, time and again, to be the core of major disasters and mass fatalities. "complacency, over-dependency on the Green Guide, and lack of appropriate tools" have been the distal causality in many such disasters.
There can be no doubt that there are characteristics of crowd dynamics which do not form part of the guidelines. Network analysis has deficiencies; crowds have turning arcs, and the concept of even distribution cannot be assumed.
2013 Update - I can point to several mass fatalities where this has, sadly, been the case.
In the examination of other crowd simulation systems we have found that, with those systems which rely on the operator’s skill, results will be limited to the interpretation of the operator. The implication here is that two differently skilled operators can produce very different results with the same system. We have also seen that the particle systems, based on fluid assumptions, are in conflict with the findings outlined in chapters 2 and 3. A solution must emerge from the simulation and not be pre-programmed as operating parameters.
(2013 Update - even to this day I still get called to assess the output of a complex simulation. All too often the basic assumptions are incorrect, limiting factors - such as density never exceed 6.25 people per square metre in some systems - are both misleading and dangerous. To highlight this - imagine a simulation developed for a site that shows egress is possible in time X. This is based on an assumption that the crowd density remains low and hence highlights that egress is possible and implies "all is good". Reality is far from this as crowds can exceed 6.25 people per square metre, density reduces crowd flow and time for ingress increases. This also impacts on the crowd behaviour - you only need to look at post mortem analysis of mass fatalities in crowds to understand the phrase I use above "misleading and dangerous").
We therefore conclude that there exists a need to produce a reliable, emergent system for crowd safety. It should have as few input characteristics as possible and be able to determine the relationship of the interactions between people, local geometry and space. The objective is thus to define a system that can analyse risk and demonstrate, via a simulation, the operational characteristics of places of public assembly with respect to safe operating parameters. It needs to be visual to aide the understanding of problems of crowd safety.
The original work, VEgAS, fell short of this requirement in that the entities relied on too many user defined parameters.
3.6.1 Emergent solution
When simple parts combine to produce a complex result, we call that system emergent. An ant colony is emergent in that the ants follow simple rules yet produce complex societies. The complexity of the society is not a function of an “ant architect” but a natural development of the interactions of many ants. [63, 64, 65, 66, 67, 68, 69, 70, 71, 72, 73, 74].
The objective of the research described in this thesis is to develop an emergent system of human behaviour with respect to crowd dynamics and in particular crowd safety. This was partially achieved with VEgAS, and is the main motivation behind the development of Legion.
The goal was to define the parameters associated with crowd dynamics and crowd safety, develop a methodology that was less prescriptive in nature and finally to produce a simulation that would allow a user to test various scenarios. This is a formidable task as we also want to build a bottom-up tool, one in which the entities would adapt to any environment we created.
To define such a system we shall first have to define the limitations of computer simulations in general. We also have to define, and solve, the many problems associated with modelling large numbers of independent entities moving as a crowd. In addition to these problems we have to choose suitable parameters for our simulation, define the input and output characteristics and the nature of the crowd as a collective.
Chapter 4 will define the principles of a simulation. Chapter 5 defines the parameters we use in the Legion pedestrian simulation and explains the relevance of these choice to the problems of crowd safety and chapter 6 demonstrates the necessary validation of the Legion crowd simulation system.
Chapter 2 - Crowd problems and crowd safety
Chapter 4 - Principles of a simulation
Chapter 5 - Legion (agent based simulation)
Chapter 6 - Validation of a computer model
Chapter 7 - Case study 1: Balham Station