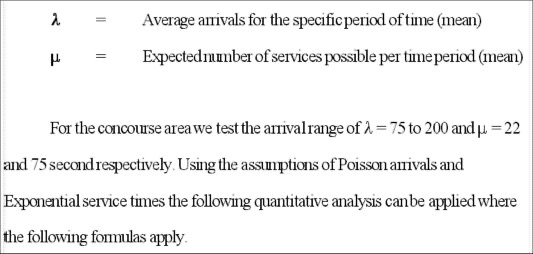
7 Introduction
The study of Balham Station was undertaken at the request of Cubic Transport Systems (CTS) who produce passenger-operated gates and ticketing machines for underground stations. CTS required an analysis and suggestions for resolving a problem of congestion in the main concourse area and to investigate if their equipment contributed to the congestion. We will examine the site, produce a model of the typical queuing and crowd movements, then analyse the results.
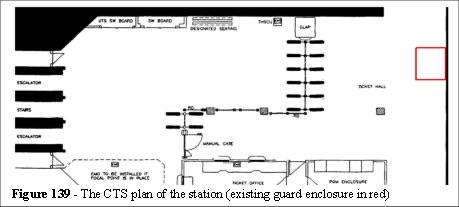
Figure 139 shows the plan of the station. The red box (top left) indicates the position of a booth. This was though to be the cause of a congestion in the area marked Ticket Hall. However its removal did not relieve the congestion.
We went to the station and observed the morning crowds, taking notes, video and photographs of the area. Two months of 24 hour video footage in total were collected during the Christmas and New Year holidays. Wednesday 3rd January (first commuter day of the year) and January 29th were singled out as the two busiest periods. London Underground Limited are very sensitive to the release of commuter data due to the continual threat of terrorism, therefore we present the data in summary form only as specified by LUL and CTS.
7.1 Ticket hall operation
The majority of passengers enter the ticket hall from the top right (Figure 139), the commuter main line station entrance. These patrons then either go to the passenger operated machines (POM - marked POM enclosure bottom left Figure 139) or to the ticket office.
Once the passengers obtained a ticket they then pass through the gates to the bottom left (down) escalator. If they hold a season, weekly or monthly ticket they can go straight through the gates from the entrances. Figure 140 shows the ticket hall during a typical morning.
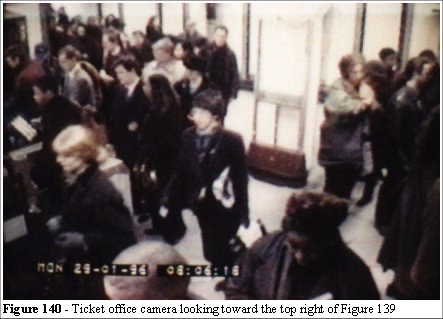
Analysis of the video footage of this area saw the number of people averaging 125 with a normal distribution during the peak period.
We note that the entrance routes to this area are 3.09 and 2.89 metres. The flow rates through these entrances (Primrose Guide) would be 123 and 115 people per minute respectively. The peak arrival rates did not exceed the maximum value for ingress so the system does not suffer from any ingress limitation.
7.1.1 Poisson probability distribution
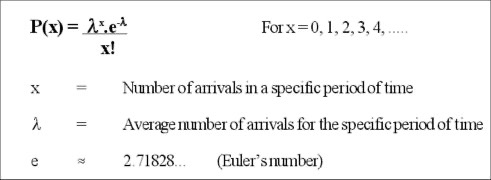
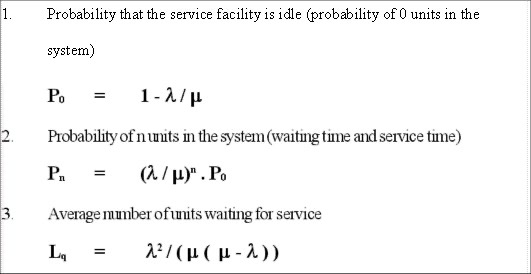
From Queuing Theory [92] we can assess the probable depth of the queues at both the ticket machine and the manual operator windows. For this we can use the Poisson probability distribution function. In queuing theory this is expressed as:
7.1.2 Service time distribution
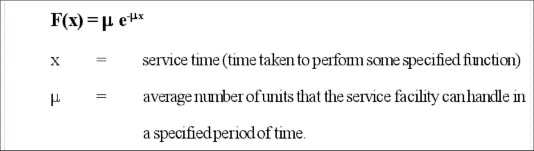
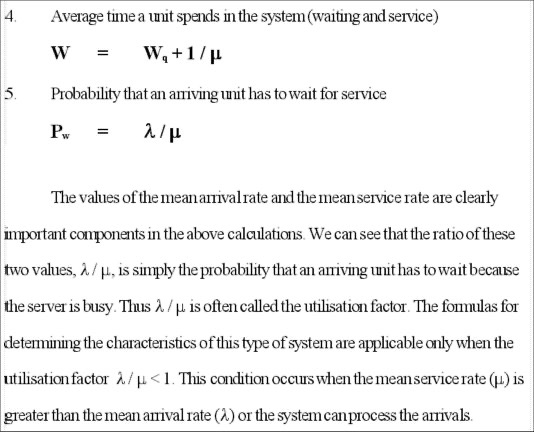
We are measuring the time it takes to perform the operation of obtaining a ticket. Whilst many patrons will complete the process in a very short time others may take a lot longer. The appropriate model for the time taken is an exponential probability distribution function. In queuing applications this is expressed as:
The videos revealed that during the busiest period (7.00 - 7:15 am) the ticket issuing machine operation (service time) was 22 seconds. The manual ticket operators’ service rates were timed at an average of 75 seconds.
7.1.3 Queuing models
This system meets the criteria for a simple queuing model.
- The pattern of arrival follows a Poisson probability distribution.
- The service time follows an exponential probability distribution.
- The queue discipline is first come, first serve
- Both waiting lines have a single channel. Patrons use either the machine or the manual operator.
First we need to consider the average depth of queue and test for the failure criteria (congestion). If the queue builds to sufficient depth this identifies the nature of the congestion, namely the queue blocks the available route. To do this we can create a spreadsheet model of the station. As we have discussed throughout this thesis the simulation has been designed to resolve the uncertainties of the guidelines. This case study relates to the accepted techniques of applied queuing theory. We introduce the concept of a focal route analysis and highlight the deficiencies of applying a queuing model in isolation.
7.1.4 Spreadsheet modelling
The first stage is to create a spreadsheet model of the arrival and service rates, taking a wide range to examine the resulting queuing depths.
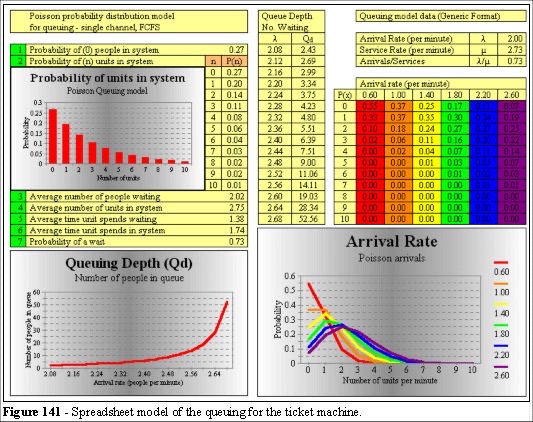
Figure 141 shows a spreadsheet analysis of the queues and service times for the ticket machine. The mean service rate is 2.73 people per minute and we are testing various arrival rates in the range of 1 to 2 persons per minute.
We can see from the graph of queuing depth that the number of people rises
exponentially where the arrival rates begin to reach the service rates. Taking the flow rates from the Primrose [5] we have an extreme value of 238 people per minute that could arrive in this area. It is therefore possible that the arrival rates can exceed the service rate and we have queuing models to assess the need for additional machines.
Using the same methods we can analyse the manual ticket operation.
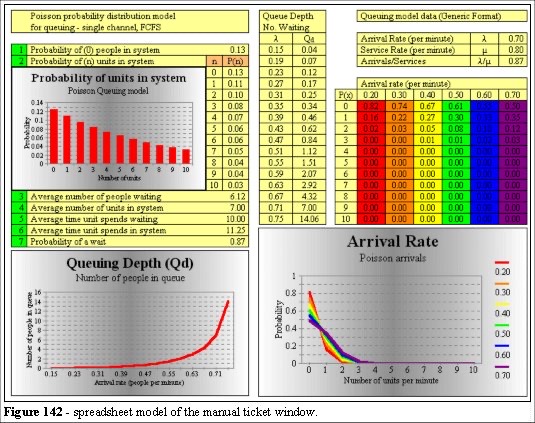
Figure 142 shows the same model applied to the manual ticket operators. There are two operators and this model is not strictly appropriate. But, as we shall reveal, the single channel calculation is very relevant to the congestion problem.
7.1.5 The queuing problem
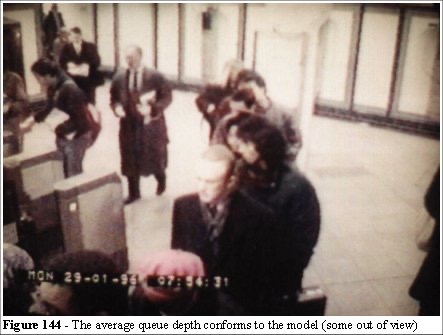
From Figures 141 and 142 we can see that if the arrival rates approach the average service time then the queues build up very quickly (Figure 144).
It is a financial consideration which determines available space and equipment installation. Hence, if the peak period has a duration of 15 minutes, then a peak loading of the system may well exceed the service rates with minimum cumulative effects. Thus, provided there is sufficient room for the queue, the overall impact to the patrons is minimal. At all other times the arrival rates are very much lower than the service rates. We have a range of tools that can be used to produce probability distribution models to determine the peak loading, its duration and the need for the additional space, number of machines, gates etc. but we are missing an important feature of these types of system with this approach.
The information missing from queuing models is the shape of the queue. In Figure 144 we see the queue forming and backing across the path of the ticket gates. This can effectively block the entrance and contribute to the problem of congestion.
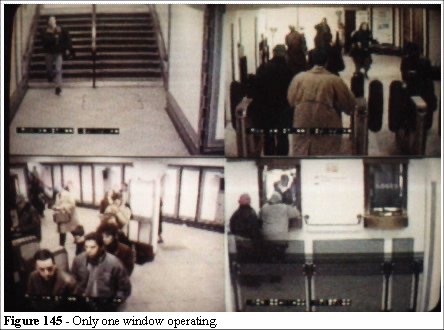
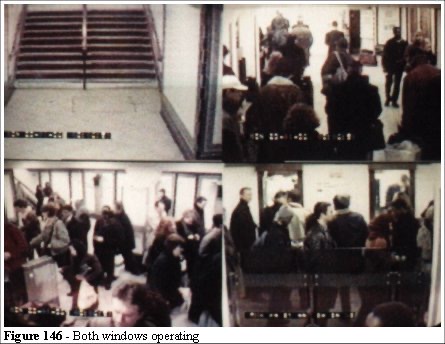
Figure 145 and 146 show the difference in queue lengths between a one and two operator configuration. The space appears adequate during busy periods with two operators and we can see that the arrival rates and service rates are well matched. So what leads to the congestion in the ticket hall? How and why does it fail?
7.1.6 Focal route analysis
When we find a situation where there is sufficient provision for the queue criteria and yet the system fails (as it does in this example) we need to consider the effects of the focal routes on the mean arrival rates. Figure 147 illustrates a simplified model of the ticket hall.
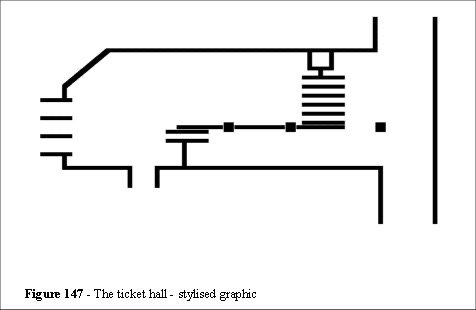
The escalators are positioned on the left-hand side of Figure 147 and the British Rail entrance is at the top right-hand corner. From both site observations and video analysis the routes that people take through the station were observed. By placing a sheet of acetate on the monitor screen and using the frame advance function we can time and measure individual steps, the average length of walk and any directional changes. To do this we plot the head positions frame by frame on the acetates. After several of these sheets are created, we simply superimpose them and can now observe the deviations people take from the focal routes.
From this analysis the speed/density and angle of deviation are derived and used in the algorithms for the routes taken by the entities.
7.1.7 Determining the focal routes
In the Balham ticket hall the principle focal routes can also be determined by drawing a line from each entrance to each exit, or delay point. The focal route analysis shows the typical morning rush hour arrangement with three gates (lower three) for incoming flow. Note the convergence of the focal route at the lower left.
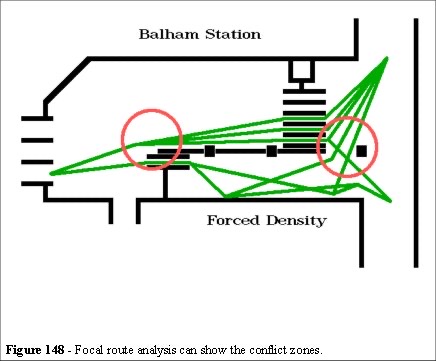
Figure 148 shows that the configuration is not ideal; there are areas where focal routes cross each other. This reveals two areas where crowd density will be forced (red circles in Figure 148) and where collisions, delays and avoidance manoeuvres will occur. At the convergence point (bottom left of Figure 148) is a tile which was frequently replacement indicating excessive use. It is interesting to watch the shuffling gait at this point to align the person with the top escalator step.
The congestion was noted to be particularly bad on Monday mornings, when the queue formed back to the entrance at the top right of Figure 148. Figure 144 shows this queue beginning to form crossing a focal route.
7.2 Balham station operation
The station passenger flow routes are illustrated in Figure 149.
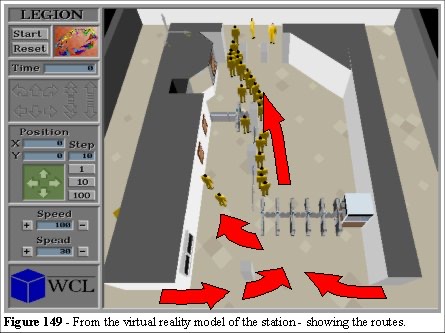
We can use a virtual reality model (VEgAS) to illustrate the depth of queues and the routes through the station. This is a very powerful technique in assessing the overall impact of a queue as you can move around the model in realtime 3D. As the crowd progresses through the simulation this techniques allows the user to "see" the station in operation and assess the decision making criteria that a passenger would take in similar circumstances. We enter the simulation and this assist in determining the factors, parameters and measures required for model building and calibration. We may expected congestion at the top of the escalators (Figure 149).
7.2.1 The Legion model
From our previous discussion we can see how the queues build up but we do not know under which conditions the ticket hall becomes congested. We know that, in part, this due to the location of the equipment but we need to quantify the problem. Although queuing theory can provide an accurate model, the analysis of the depth of the queue is only part of the problem. We need to assess how this queue interferes with the flow of people who wish to pass through the queue. Congestion occurs when the mean arrival rate approaches the mean service rate. In practice when the utilisation factor = 1 any randomness in the system will result in a rapid increase in the overall depth of queue. The shortcomings in focal route analysis is that we cannot ascertain the arrival times of passengers, their distribution to manual or automatic machines, or the nature of the interaction on the focal routes.
The analysis of crowd dynamics is complex and to try and apply a single mathematical solution to the problem, as we have seen from queuing theory and focal route analysis, results in partial solutions. However, we can simulate the environment and simplify the analysis by using the combination of queuing theory, focal routes and the Legion simulation. Let us break the problem into components and apply a more comprehensive analysis to the problem.
7.2.2 Determining focal routes with Legion
We can determine focal routes by hand by connecting the entrances to the exits and looking for the areas of most overlap. This method gives us a good first pass approximation to potential problems in normal operational use but it is a qualitative not quantitative analysis. In a more complex environment it would prove difficult to analyse all of the available routes by this method. We may also miss some routes, especially those we did not anticipate (as we saw in the gate C short cut and the Wembley Complex Station example in chapter 2). We automate the focal route analysis process.
7.2.3 Short-cut analysis - the "ant algorithm"
The objective is to automate the process of finding all the shortest routes on a plan of the environment. The appropriately named "ant algorithm" achieves that goal by imitating ants. This algorithm works by using the dynamic space utilisation map as the objective, creating a feedback loop from the entity to the environment. The entity goes to the nearest point of highest space utilisation, thereby reinforcing it (a similar mechanism to the erosion experiment discussed earlier). A timed decay erodes unused trails. Using entities of different speeds then straightens the trails and we are left with the map of all of the straightest, shortest routes.
The tricks that ants use require no mathematically ability. An ant trail straightens itself to the optimal, shortest route because the ant lays its pheromones with its hindquarters and detects the trail with its antennae. Corners are rounded by the length of the ant with each successive ant the line straightens by a small fraction. The action of many ants performs the mathematical function of straightening the line. By copying the ant we have developed a searching algorithm which reveals all the focal routes automatically. However, as some of those routes are available only at certain times of the day, so the technique requires some manual intervention.
7.2.4 Ticket hall - space utilisation
Using the algorithm with a combination of varying step sizes and erosion rates the model combines a geometric analysis with a space utilisation map in a single pass. Figure 150 shows the trails (bottom screen). Note that the intermediary process of excluding certain routes has been omitted. To achieve this in the simulation we "paint" no-go areas by hand, the algorithms treats those as walls.
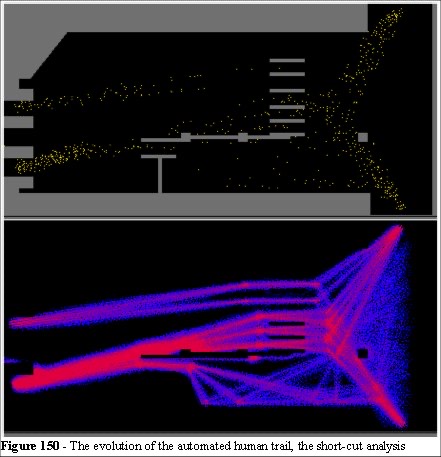
This technique allows us to evolve a short-cut analysis, the straightest routes apply to the free space individuals but the space utilisation map is cumulative in nature. The long term evolution of the shortest route is independent of any individual entity but is a function of the crowd dynamics. Namely the width of the space used across the shortest route relates to the number of entities using that route over time.
We can now combine the results of the space utilisation with queuing theory to produce a more appropriate analysis of the ticket hall. This is the superposition of the queue depth with the space utilisation map. Where the two overlap we can tell the areas of highest use, shortest path and, as that focal route crosses the average depth of queue, we now know the areas that will appear congested. The solution to the problem is now obvious, either to shorten the queue or allow more space for queuing.
7.2.5 Ticket hall - creating more space
As the walls and support pillars cannot be moved we consider the re-location of the equipment. Figures 151 and 152 illustrate that a subtle can change create more space for the queue. We run a "before" and "after" simulation to quantify the change.
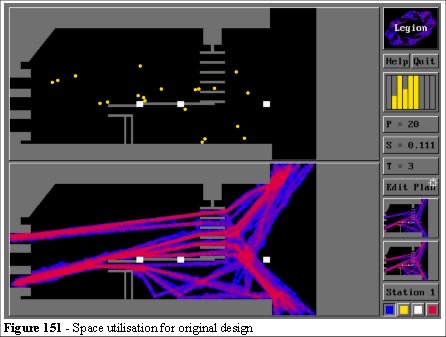
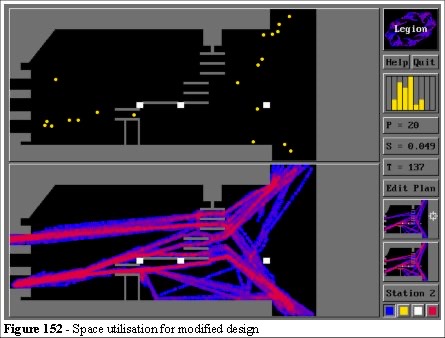
The differences between Figures 151 and 152 can be seen in the area to the right of the ticket gates. We have straightened the route by using an offset gating array. The combination of focal routes and space utilisation, within the Legion simulation, provide us with a powerful methodology to understand and design space around people. Space utilisation can also be used to determine optimal designs by evolving human trails (as we saw in chapter 6) where the function of minimising the space utilisation is used. But we have not addressed the problem at Balham.
As we can see from Figures 151 and 152 that there should be sufficient space for queuing without the need for increasing space, the depth of queue appears to be below the focal route requirements, there should be no congestion in this area. We have to return to the site to see where the model and reality differ.
7.3 Queueing
When we began the Balham project there was a guard enclosure to the right of the plan (along the right-hand wall indicated in red in Figure 139). They removed that enclosure to try and alleviate the congestion but it had little effect.
From the models (see Figures 151 and 152) it is clear why; the enclosure was not on a focal route, it did not contribute to the problem. We can now see that adding more space in areas that are neither on the focal route or queue path will have no effect on the congestion, an obvious statement perhaps but now quantified.
The problem in the ticket hall can be seen in the analysis of Figures 141 and 142 in which, with two independent queues (single channel) there should be a queue of average depth 7-14 people as the arrival rate approaches the service rate.
However, the manual ticket operators are a two channel system so that queue depth should reduce to an average of 0.187 people [for details see Gross 93].
Queues interact with the focal routes. The queue from the manually operated ticket windows backed up through the ticket hall (Figure 147). This produces a very different result from the one that two channel queuing theory would predict. We use a multiplexer to analyse the problem from the video tapes.
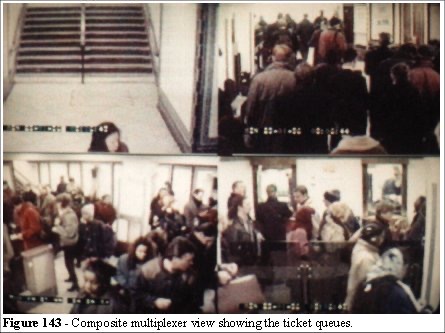
7.4 Multiplex views
A multiplexer is a device that combines several video cameras’ views onto a single image. The advantage is that you can see several views, of different parts of the ticket hall, at the same time. The congestion problem suddenly became apparent when we analysed the multiplexed view of the ticket hall in peak time operation.
Figure 145 shows the queue backing into the ticket hall (bottom left quadrants). There is only one operator window open (Figure 145 - bottom right).
Figure 146 shows that there is no queue in the ticket hall (bottom left quadrants) when both windows are open. That is consistent with the queuing theory. The congestion problem was that one of the operators would take his coffee break during the morning rush hour. A single channel model in this area (Figure 141) matches the observed queue depth and we now understand the congestion problem. It was solved by rescheduling coffee breaks.
7.5 Problem analysis
This problem was associated with the operation of the manual ticket process. Making more space available was thought to be the solution, but the dynamics of the situation were not simply a function of the geometry, number of people and queuing.
The model can demonstrate the effects of design on the crowd dynamics, but we still have to be aware of the human element and its effect on crowd problems. In the case of Balham Station the queuing space can be alleviated by design (Figures 151 and 152) but the operation of manual ticket issue coffee breaks will still create a problem where the depth of queue backs into the focal route. It is therefore important to understand the operations of a site from the perspective of site management.
A model does not provide all the answers as we saw from queuing and focal route analysis. But it does provide the necessary tools to quantify the requirements and the effects of change. In this case the measure of the mean arrival rates, service rates and the appropriate queuing model tells us the required space for the queue.
The combination of the simulation, the conventional queuing models and some operational knowledge provides the complete solution to the problem.
7.6 Analysing crowd behaviour
There is much debate as to whether people behave differently in a crowd than they do in free space [94]. The ideas of a group think provokes heated debate among the psychologists. There are many psychological factors which influence human behaviour, both in free space and in a crowd. The Legion simulation is not a model of these psychological factors, neither is it explicit in modelling human behaviour (such as coffee breaks). It is a model of the dynamics of crowd movement.
By "dynamics" we mean the influence that density has on flow rates, that geometry has on density and that the speed distributions of the individuals have on the overall crowd. It is a solution to the less obvious problem of exploitation of short-cuts and the effects of cross flows (collision and avoidance effects).
We have discussed in chapter 4.4 how the psychological factors relate to dynamics of crowds. Although we cannot define the exact numerical values of those factors it does not prevent us from experimenting with the a range of values.
7.7 Conclusions to the Balham study
Generally simulations and models provide two types of information. They prove or disprove a theory by way of supportive data or they provide an insight to the nature of the problem. Often the need to visualise the problem is required to appreciate and understand the extent of the problem and impact of the solution.
Combining the visual aspect of virtual reality with the use of the Legion simulations (to determine the space utilisation and focal route analysis) provides a foundation for quantitative modelling of crowd dynamics and analysing operation performance. The interactive design modelling capability of Legion also provides some level of assessing the impact, for example, the location of ticket machines, the interaction of queues and clearways, and the optimal use of space. Queuing theory provides the quantitative data for the depth of the queue. The combined system produces comparative analysis when locations are tested. This can be used in micro analysis; such as door widths, gate entrances and testing the differences that an additional barrier would make to the flow rates. It can also be used in macro analysis, such as the Sydney Olympics.
Balham Station’s crowd flow would be improved by staggering the input gates to reduce multiple route interference. Also the gate located nearest the escalators could be moved back toward the ticket hall area. This would allow more space for the predicted depths of queues. The operator now has the data to assess the relative costs of these design changes against the relative benefits.
The analysis of the focal routes would save the cost of relocating the booth (Figure 139). Operational analysis would determine the ideal time for coffee breaks.
7.8 Implications for Legion
The Balham model led to some meaningful conclusions for further development of the Legion simulation. Firstly, an important relationship between the distribution of the speed of the entities was the primary factor that determined crowd parameters. This, coupled with multiple focal routes, produces a space utilisation map which can then be used to determine the optimum design parameters.
Multiple crossing focal routes determines the number of interactions, which in turn determine the natural crowd flow and, to some extent, the forced crowd densities. This idea could be expressed as a series of mathematical formulas once the techniques were established. The models could also be used to produce empirical mathematical formulas by experiment. Experience in model-building will lead to greater understanding of these phenomena and a more robust guideline for designing space around people. In its present form the analysis is both quantitative and qualitative. Analysis of queuing theory breaks down in multidimensional, multi-objective space, as does network flow analysis. The combination of focal route analysis and Legion simulations prove to be more intuitive and easier to use than the calculus involved in purely numerical methods.
Finally, Legion can be used to automatically find the focal routes and short-cuts that may be exploited in reality. The algorithms can be set to iterate, as we saw in the validation of the human trails, leading to optimal design configurations. The technique provides an accurate method for planning and design for a variety of crowd parameters.
Chapter 2 - Crowd problems and crowd safety
Chapter 4 - Principles of a simulation
Chapter 5 - Legion (agent based simulation)
Chapter 6 - Validation of a computer model